A research stack built on one idea: price is an output, not an input.
Ocs Ai Trader runs as a two-part loadout on TradingView. One emulates a
virtual trader to surface signals; the other maps the forces that
actually move price — liquidity and order-flow delta — and filters the
noise. Engine and clutch. Both are decision-support tools, not a signal
service.
Signal Generator
Ocs Ai Trader
Ocs Ai Trader is a virtual trader you can watch think. It turns raw price and
volume into one clear call — buy or sell, with five booked targets (T1–T5) and a
catastrophic stop — so you always know the plan before you act.
Reads the market — price, volume and order-flow delta across adaptive averages and momentum.
Weighs the evidence — confidence filters keep only the high-probability signals that agree.
Learns what works — machine-learning pattern recognition matches each setup to proven behaviour.
Hands you a plan — an actionable buy/sell with T1–T5 targets and a clear stop.
Under the hood it’s serious quant — Ehlers dominant-cycle detection, adaptive filtering,
Gaussian smoothing, TRIX momentum and CVD divergence — keeping it accurate from the
1-minute to the weekly, on any liquid market.
Signal pipeline · sample
Works on all timeframes1m → 1W, scalp to invest
Non-repaintinglevels confirm on bar close
Any liquid securitystocks · futures · FX · crypto · commodities
Every major world market1.4M+ securities worldwide
Adaptive & plug-and-playmolds to your personal style
Most indicators try to predict price. This one doesn’t — it maps the two forces price has
no choice but to obey. Liquidity is the clutch (where price gets fueled,
stalled or rejected); delta is the engine (the live tug-of-war between
aggressive buyers and sellers). Read them together and you stop guessing where price might
go — you see whether it actually has the conditions to get there.
Liquidity Engine — five regime-aware support/resistance lines and three
liquidity bands (positive · uncertain · negative), plus a cycle oscillator that flags
divergences before price turns. Every regime is colour-coded — read it at a glance.
Delta Engine — dominant buy/sell volume cycles, an adaptive delta filter
with self-calibrating boundaries, cumulative-volume-delta (CVD) columns, and per-candle
▲/▼ force arrows.
One question, every bar — “where is liquidity, and is the order flow
strong enough to break through it?”
Confluence over signals — a force arrow inside the right band, with CVD
and the dominant cycle agreeing, is a high-grade setup; the same arrow in chop is noise.
The “Hands-Off” filter — uncertain band + tangled cycles + flat CVD means
the clutch is slipping. The indicator tells you to sit the chop out.
Two modes — Liquidity and Delta — both adaptive across assets and timeframes; it shines
intraday on liquid markets (index futures, large-caps, major FX, BTC/ETH).
Non-repainting: every level confirms on bar close.
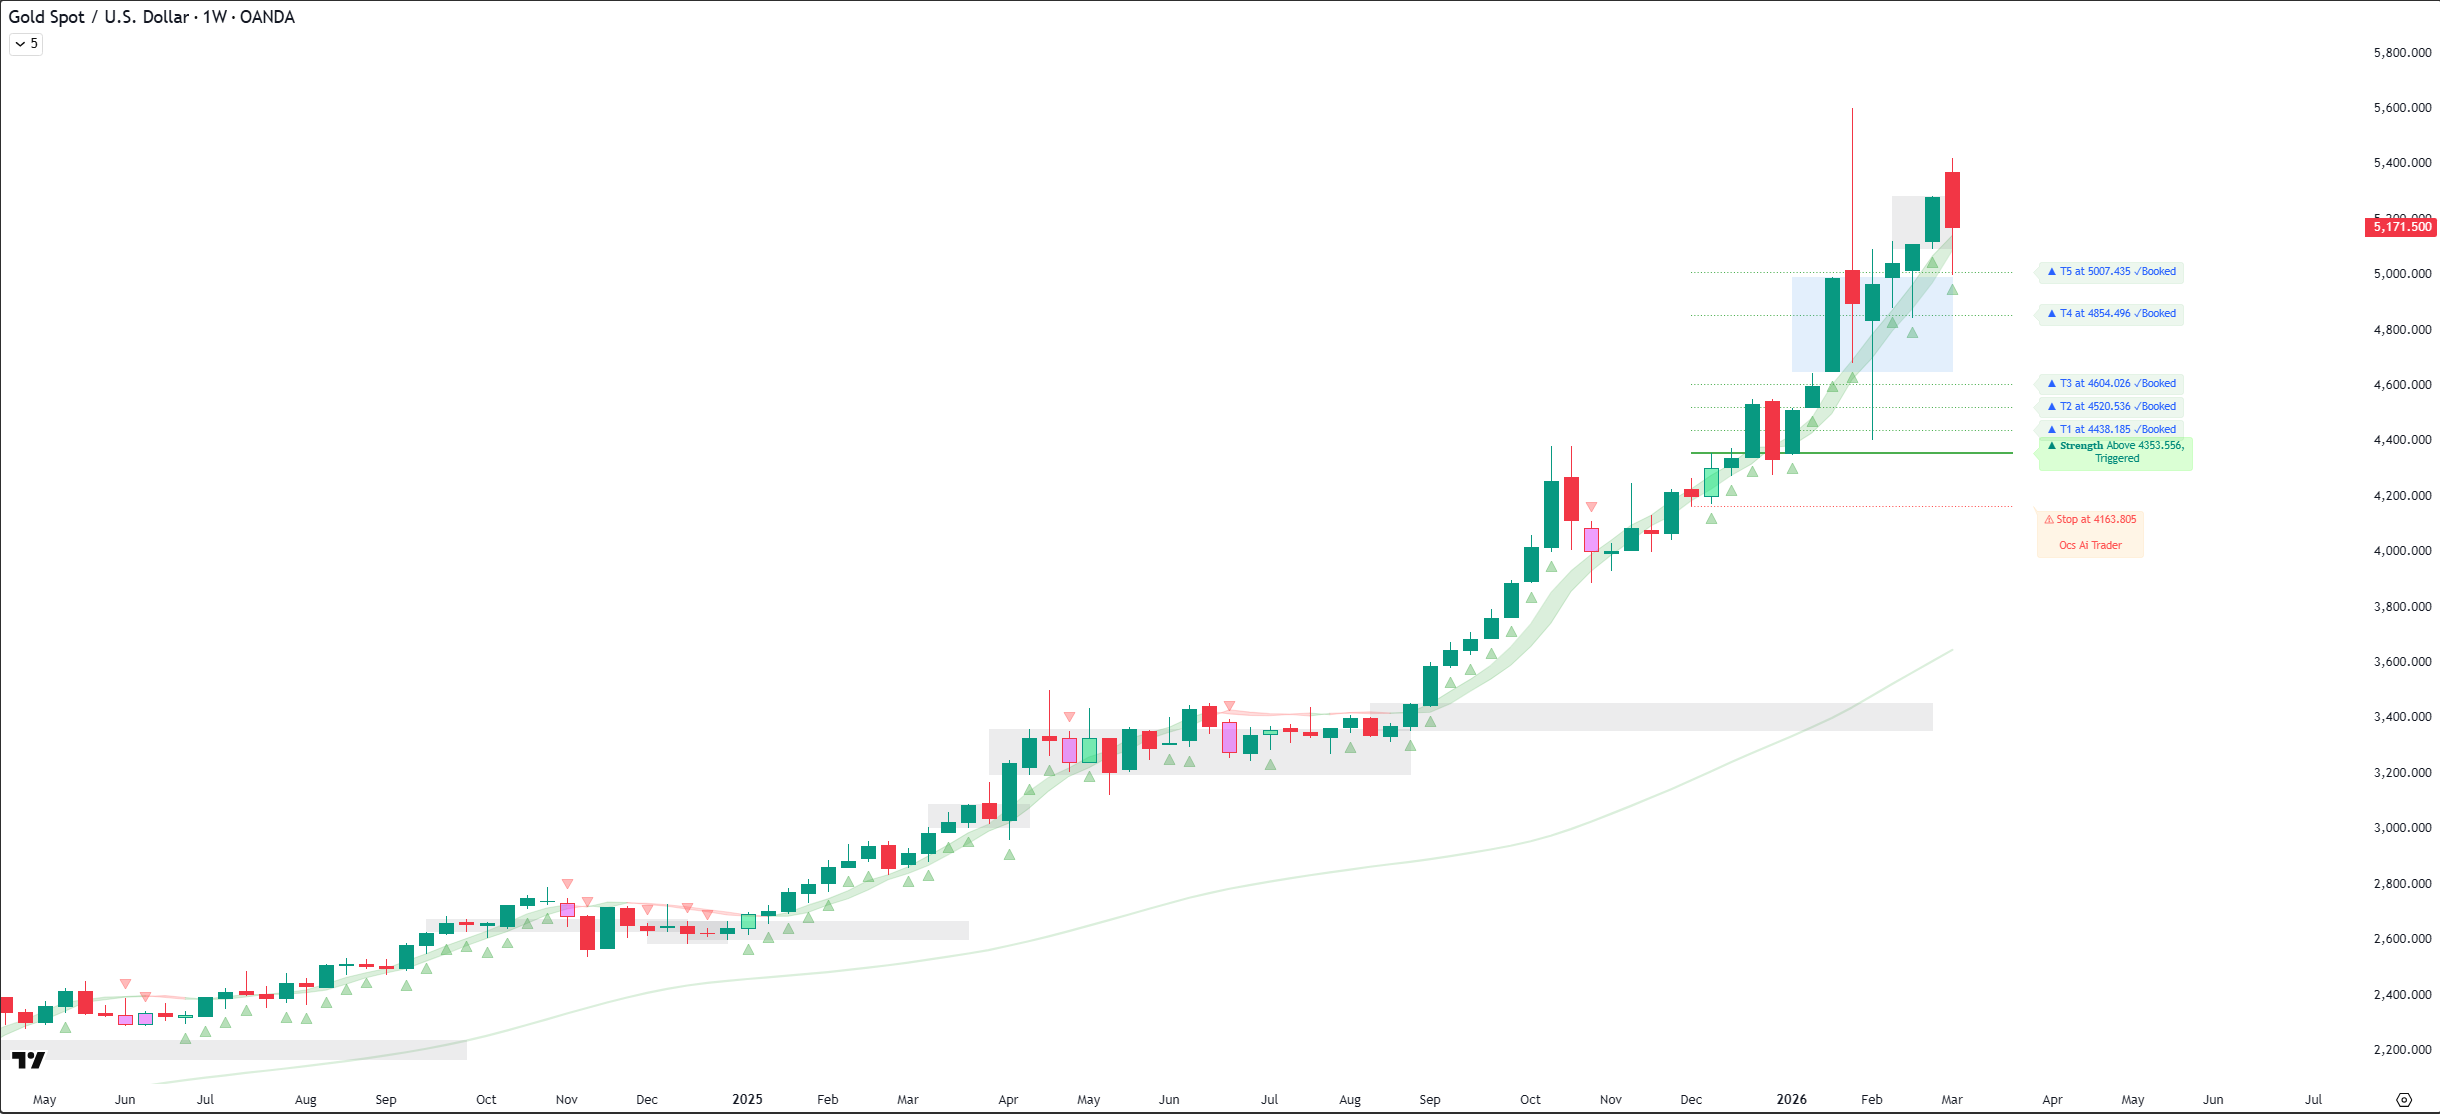
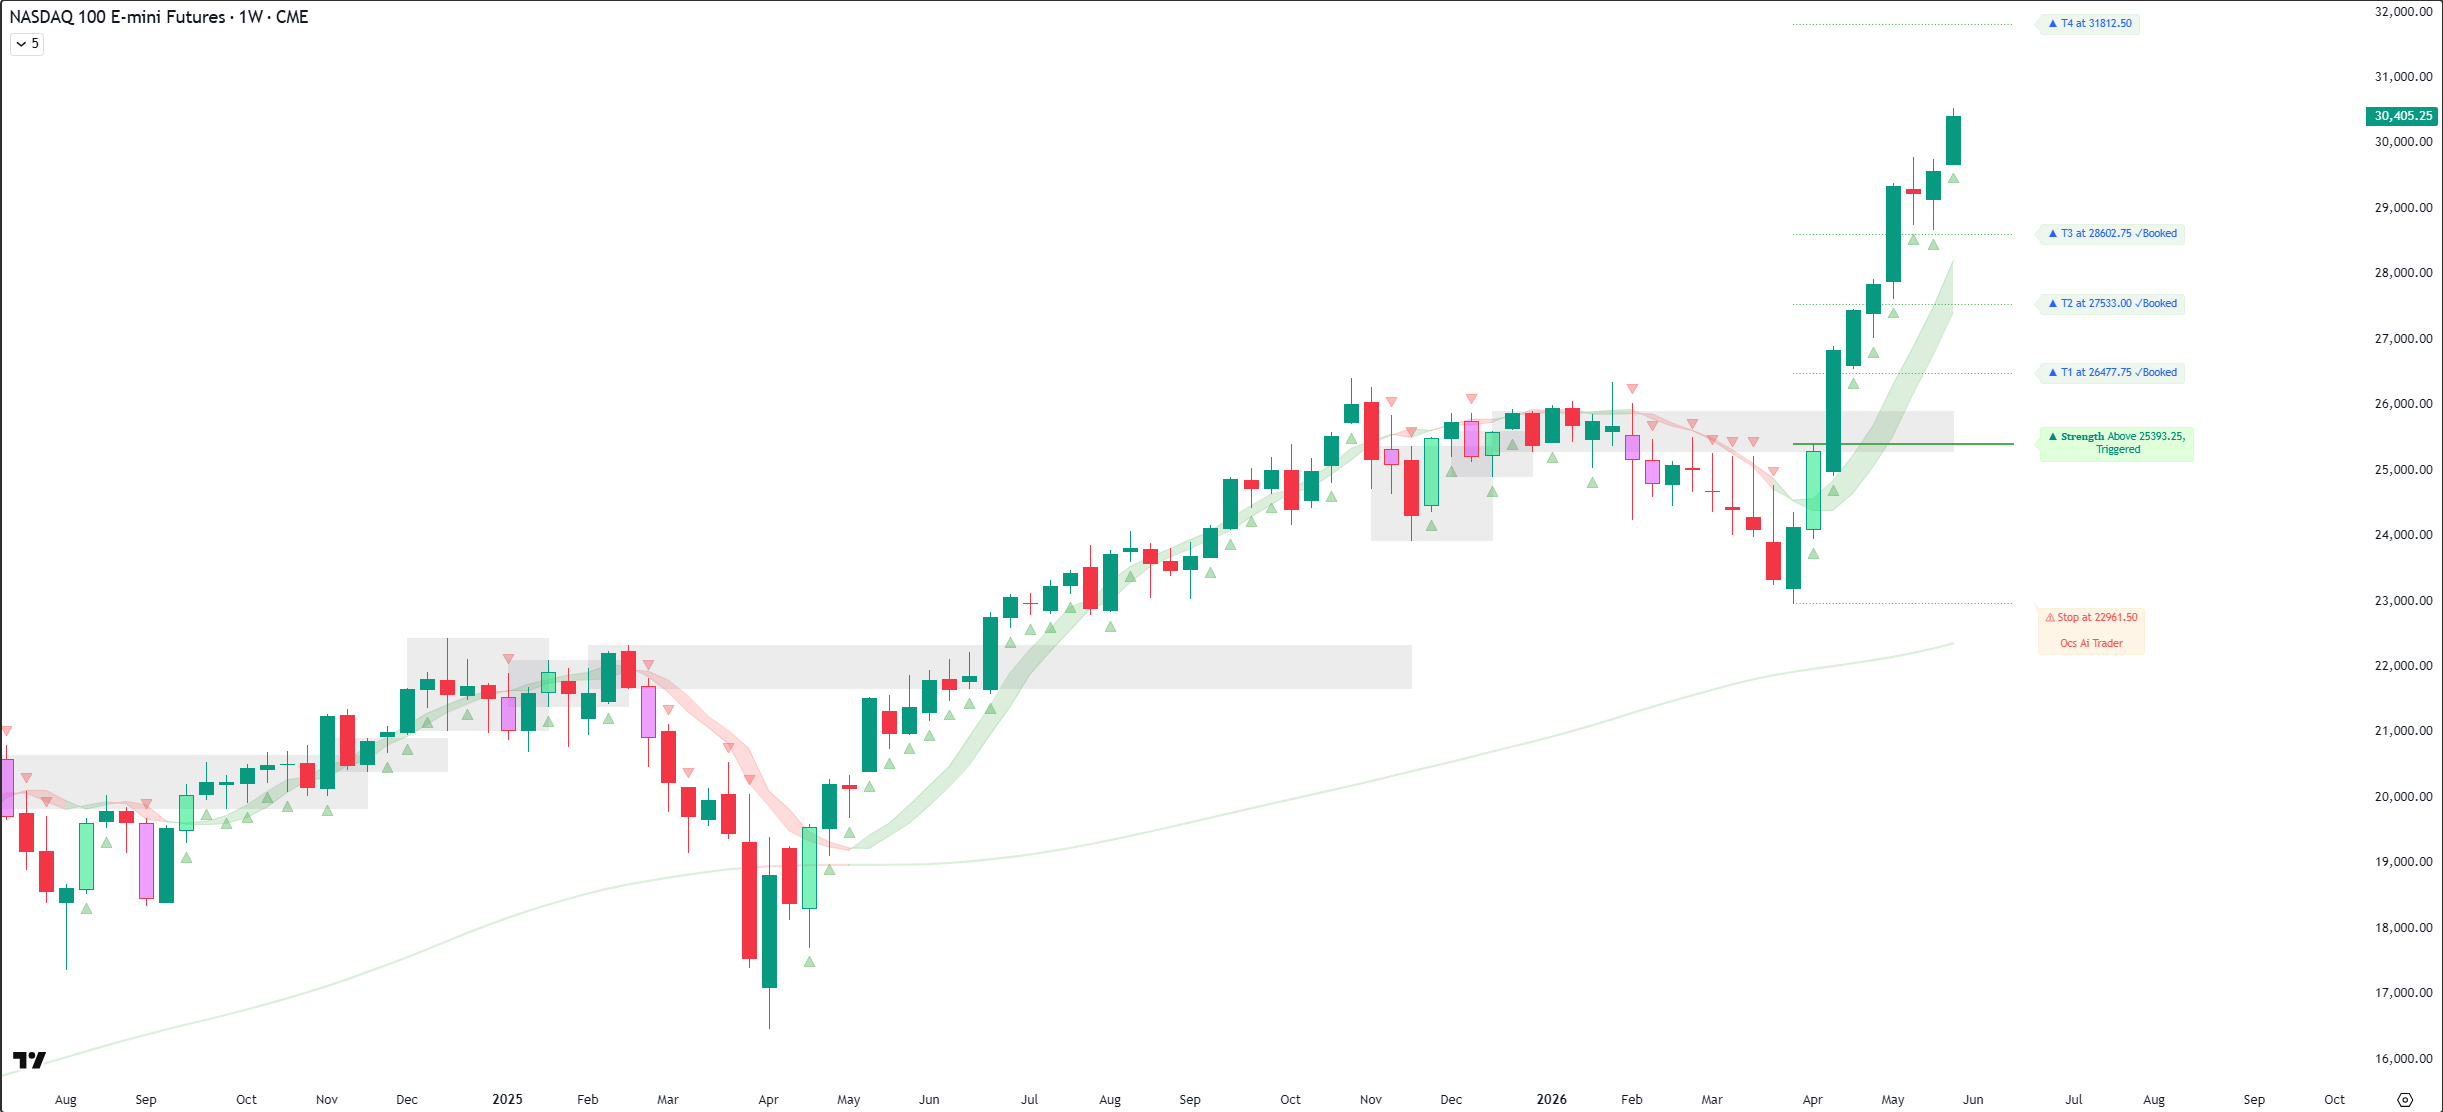
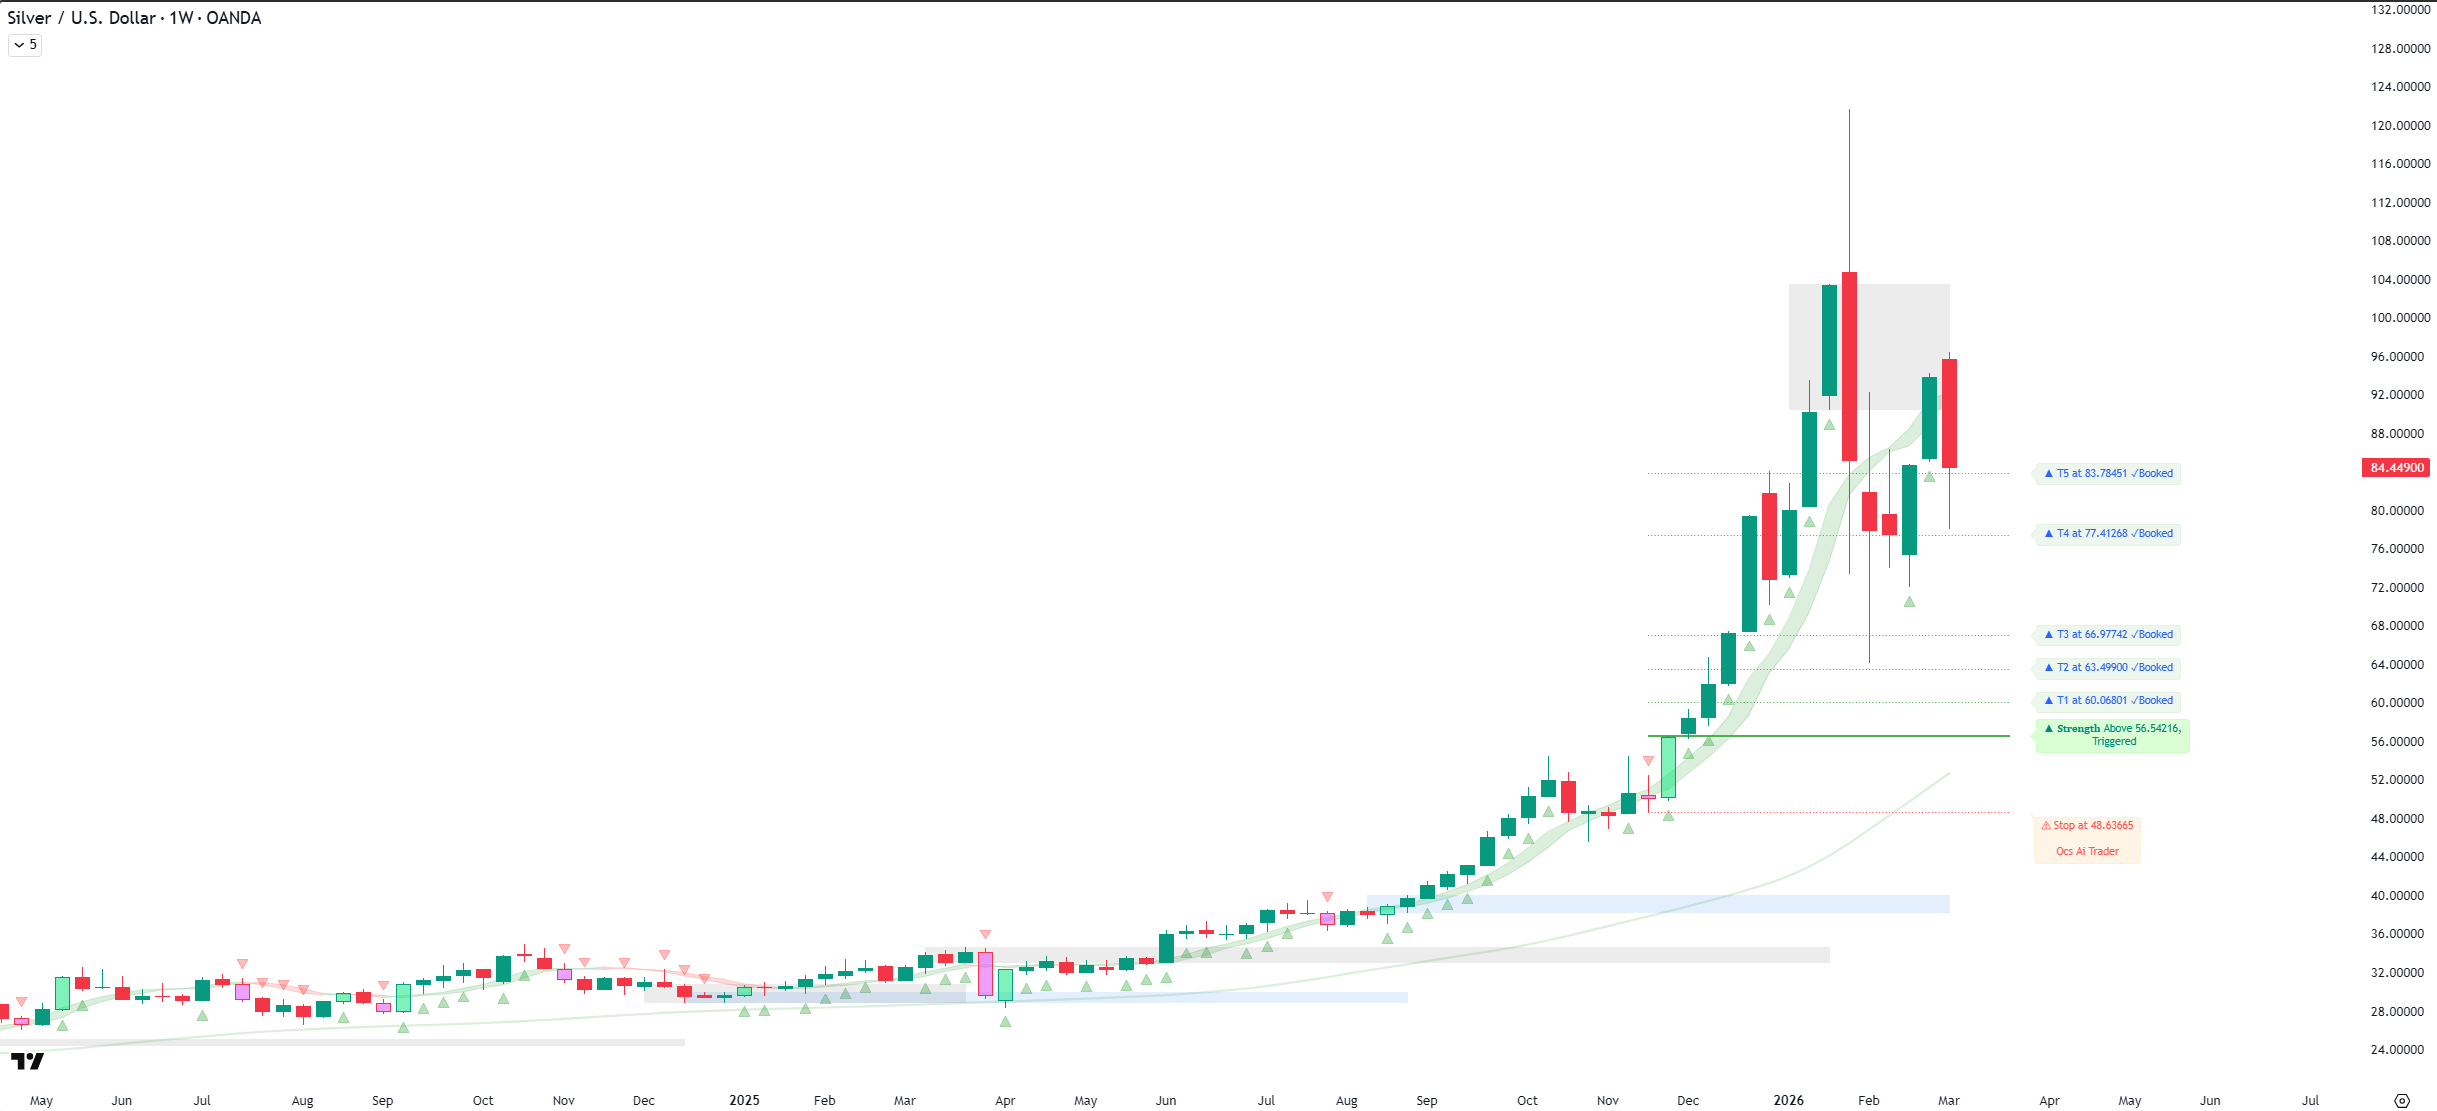
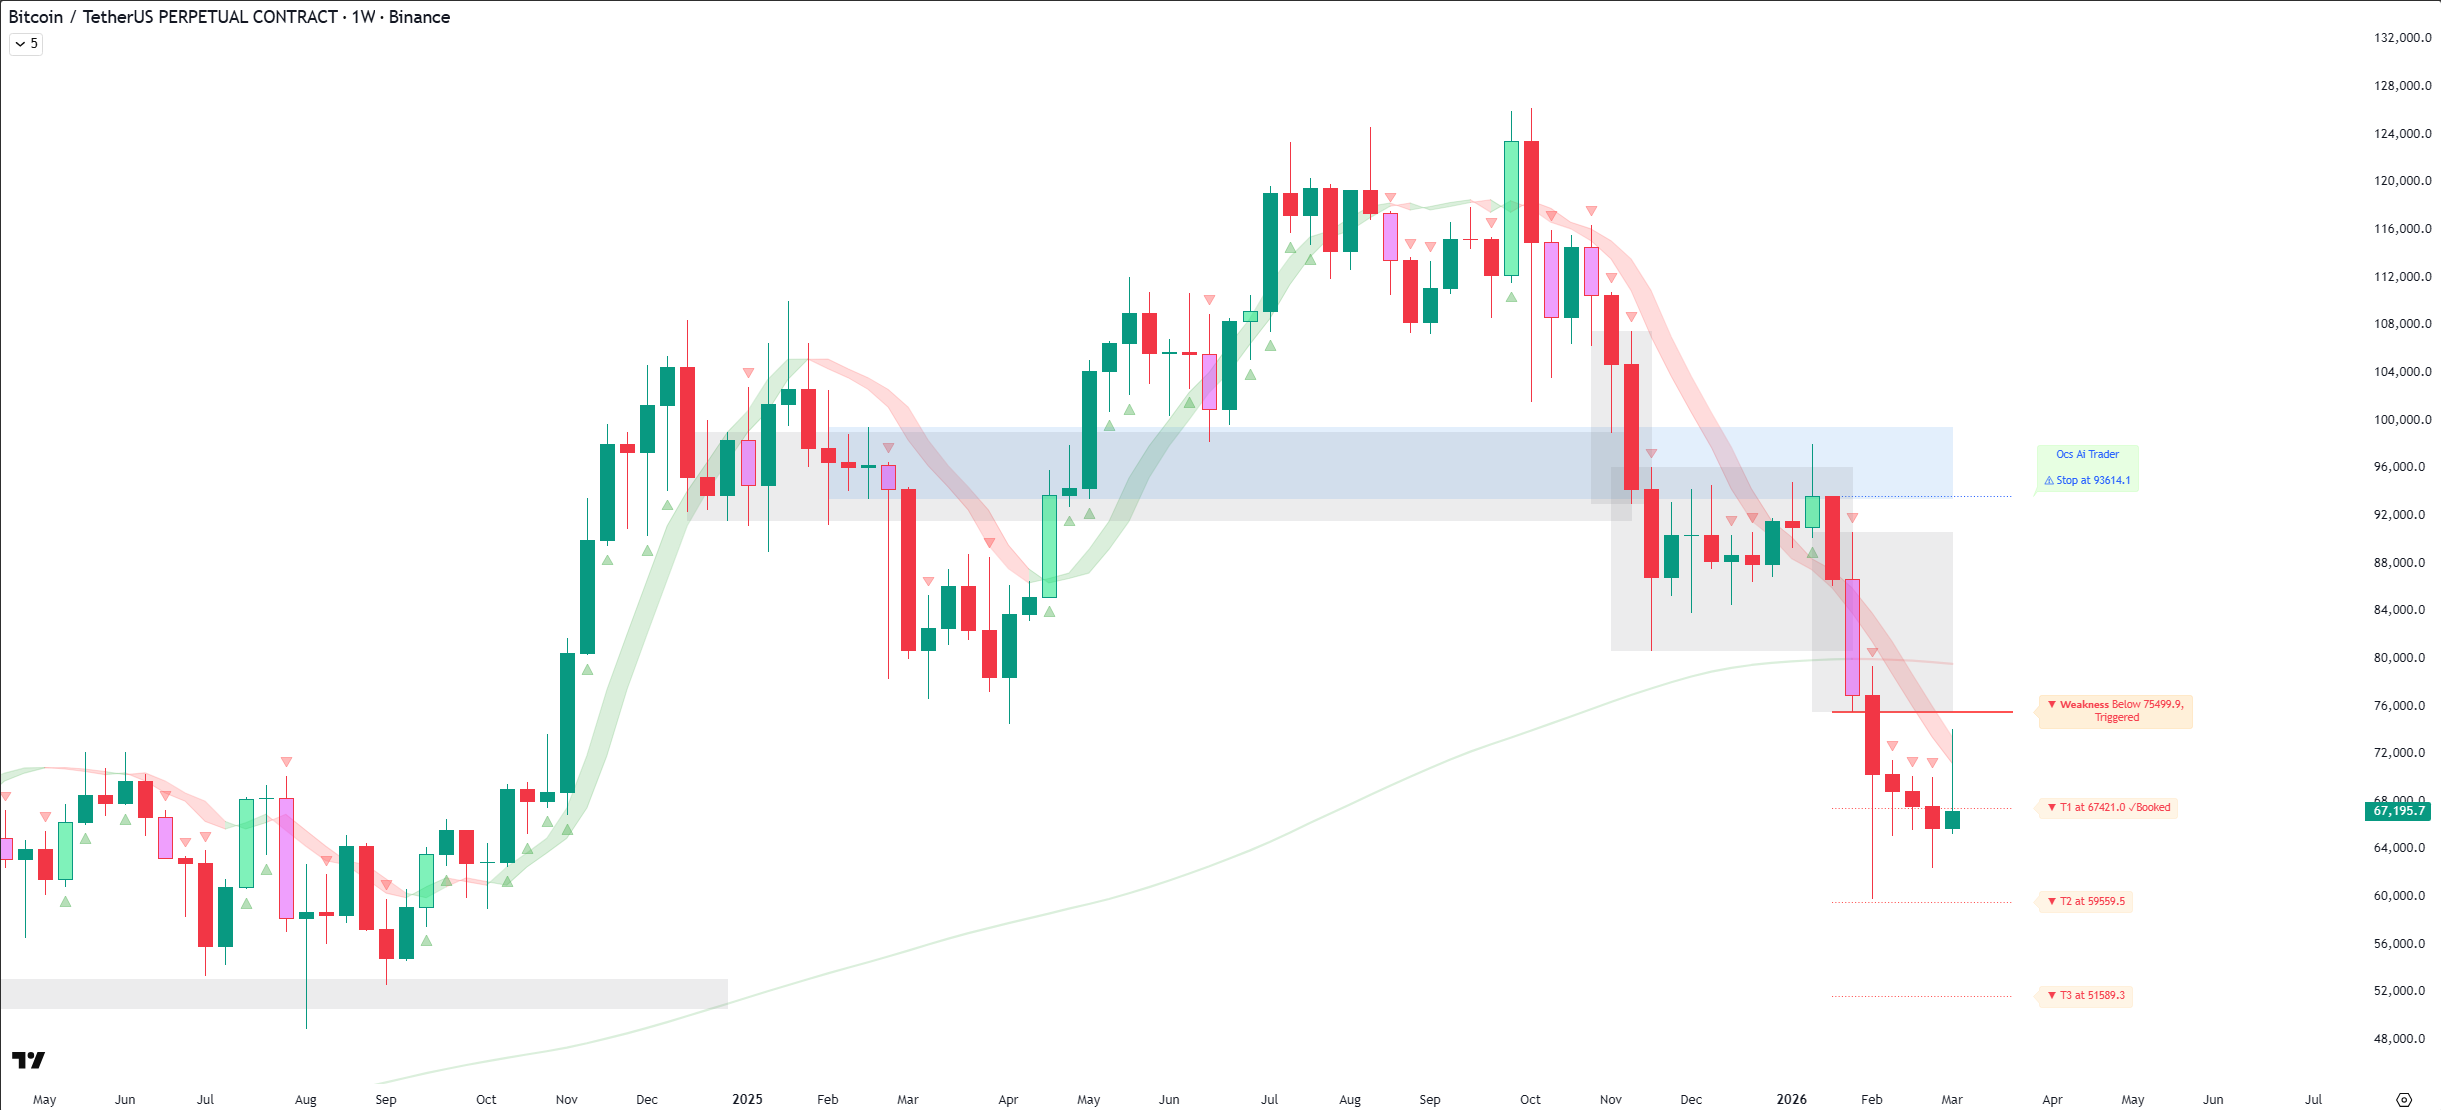
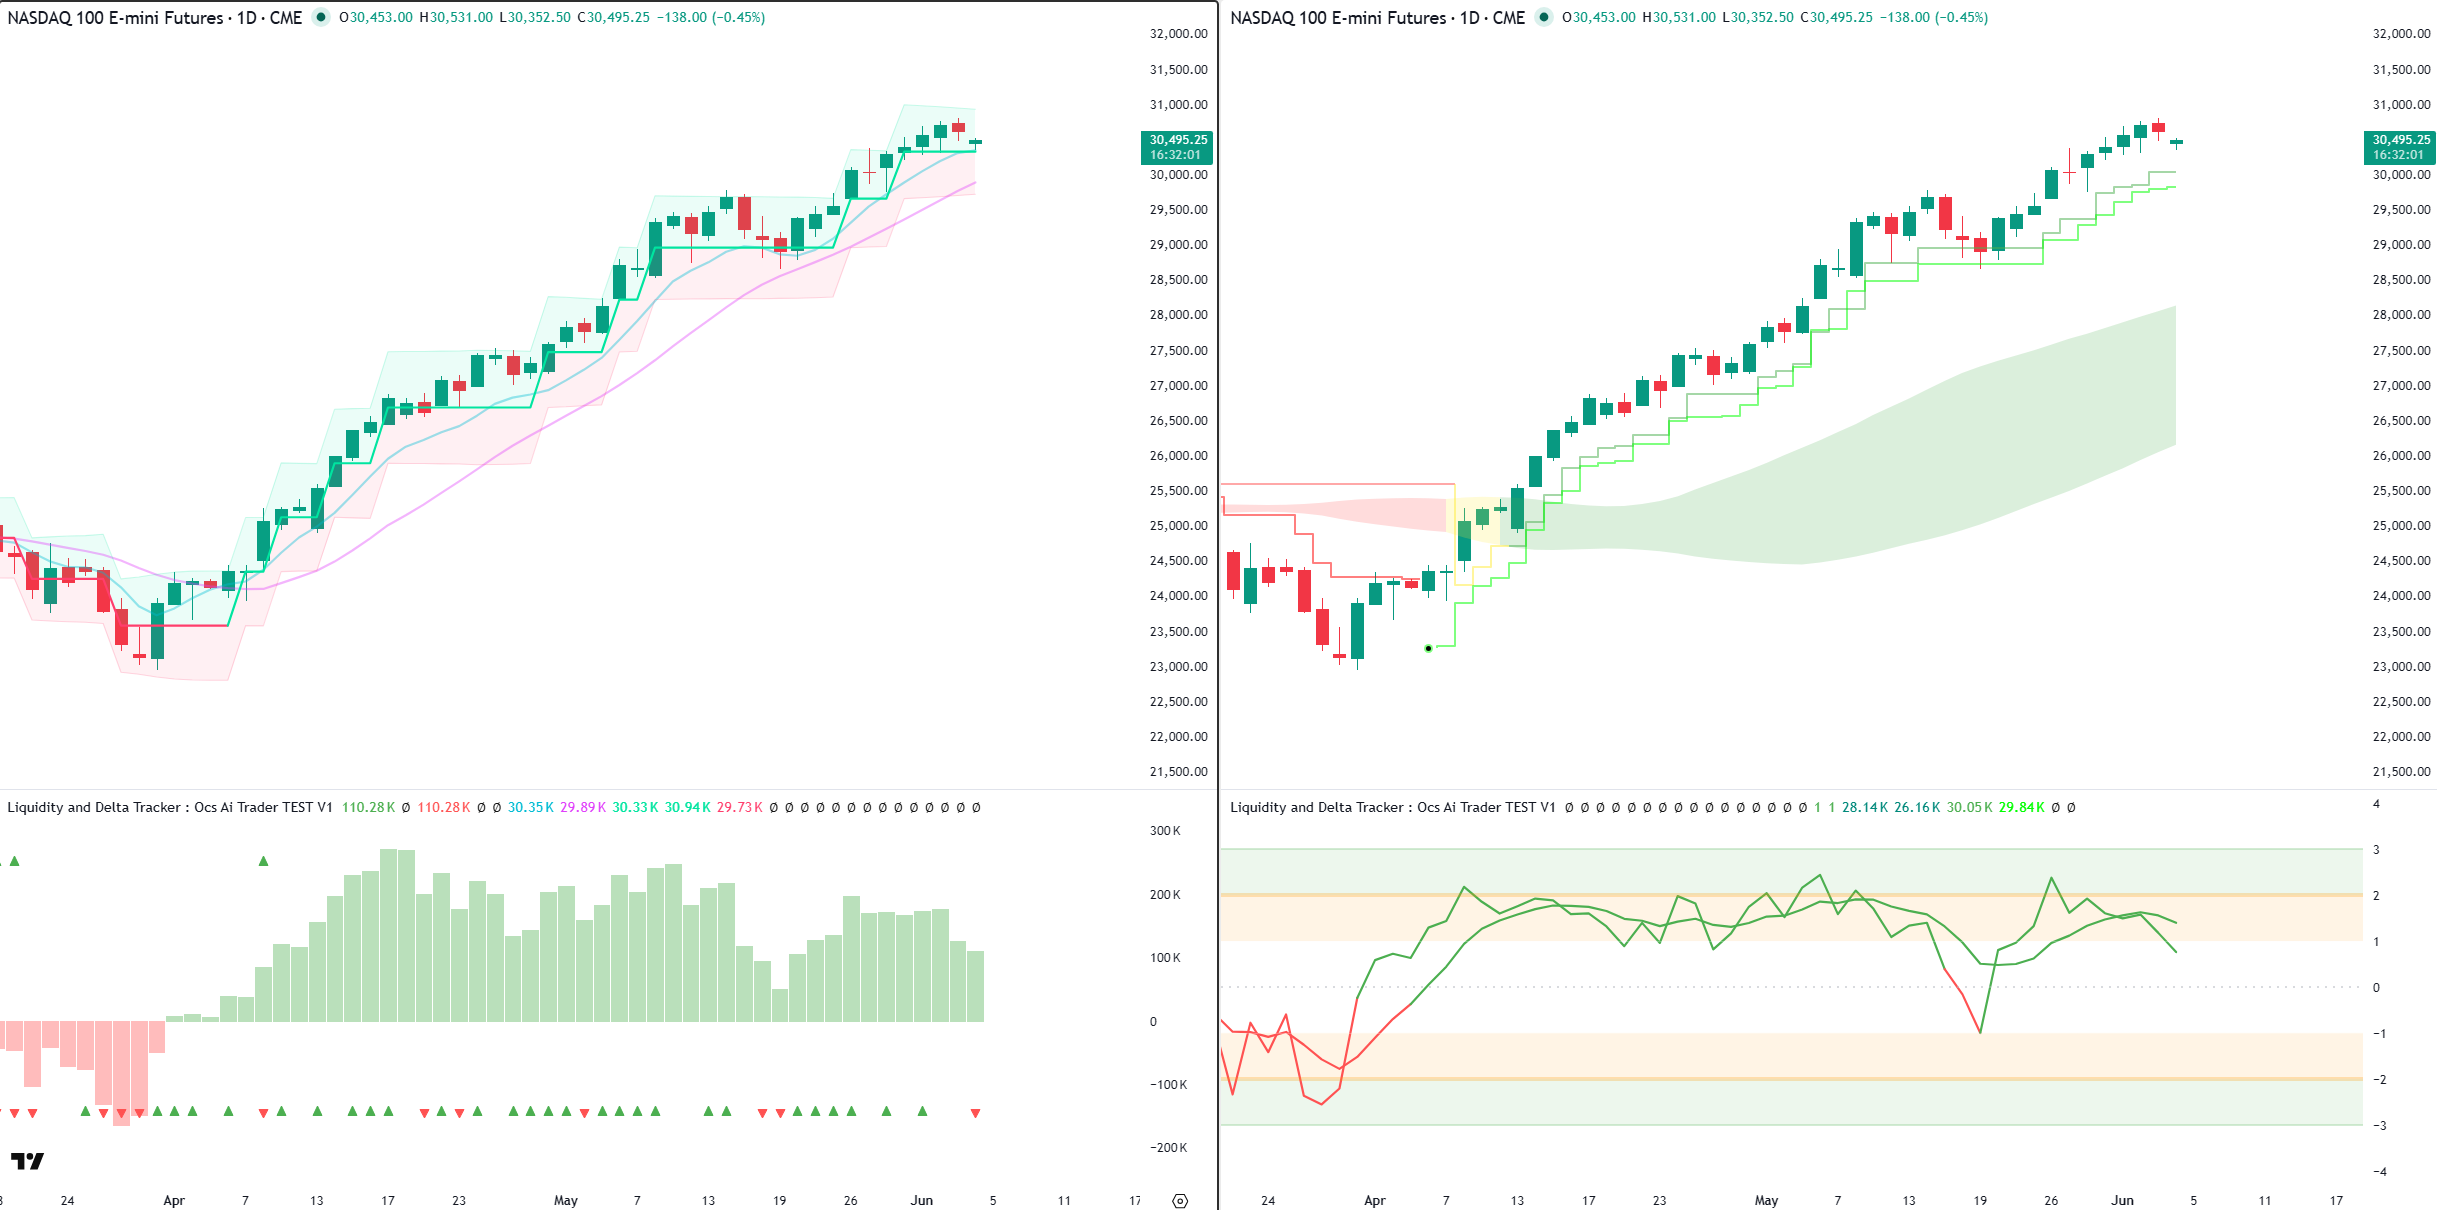
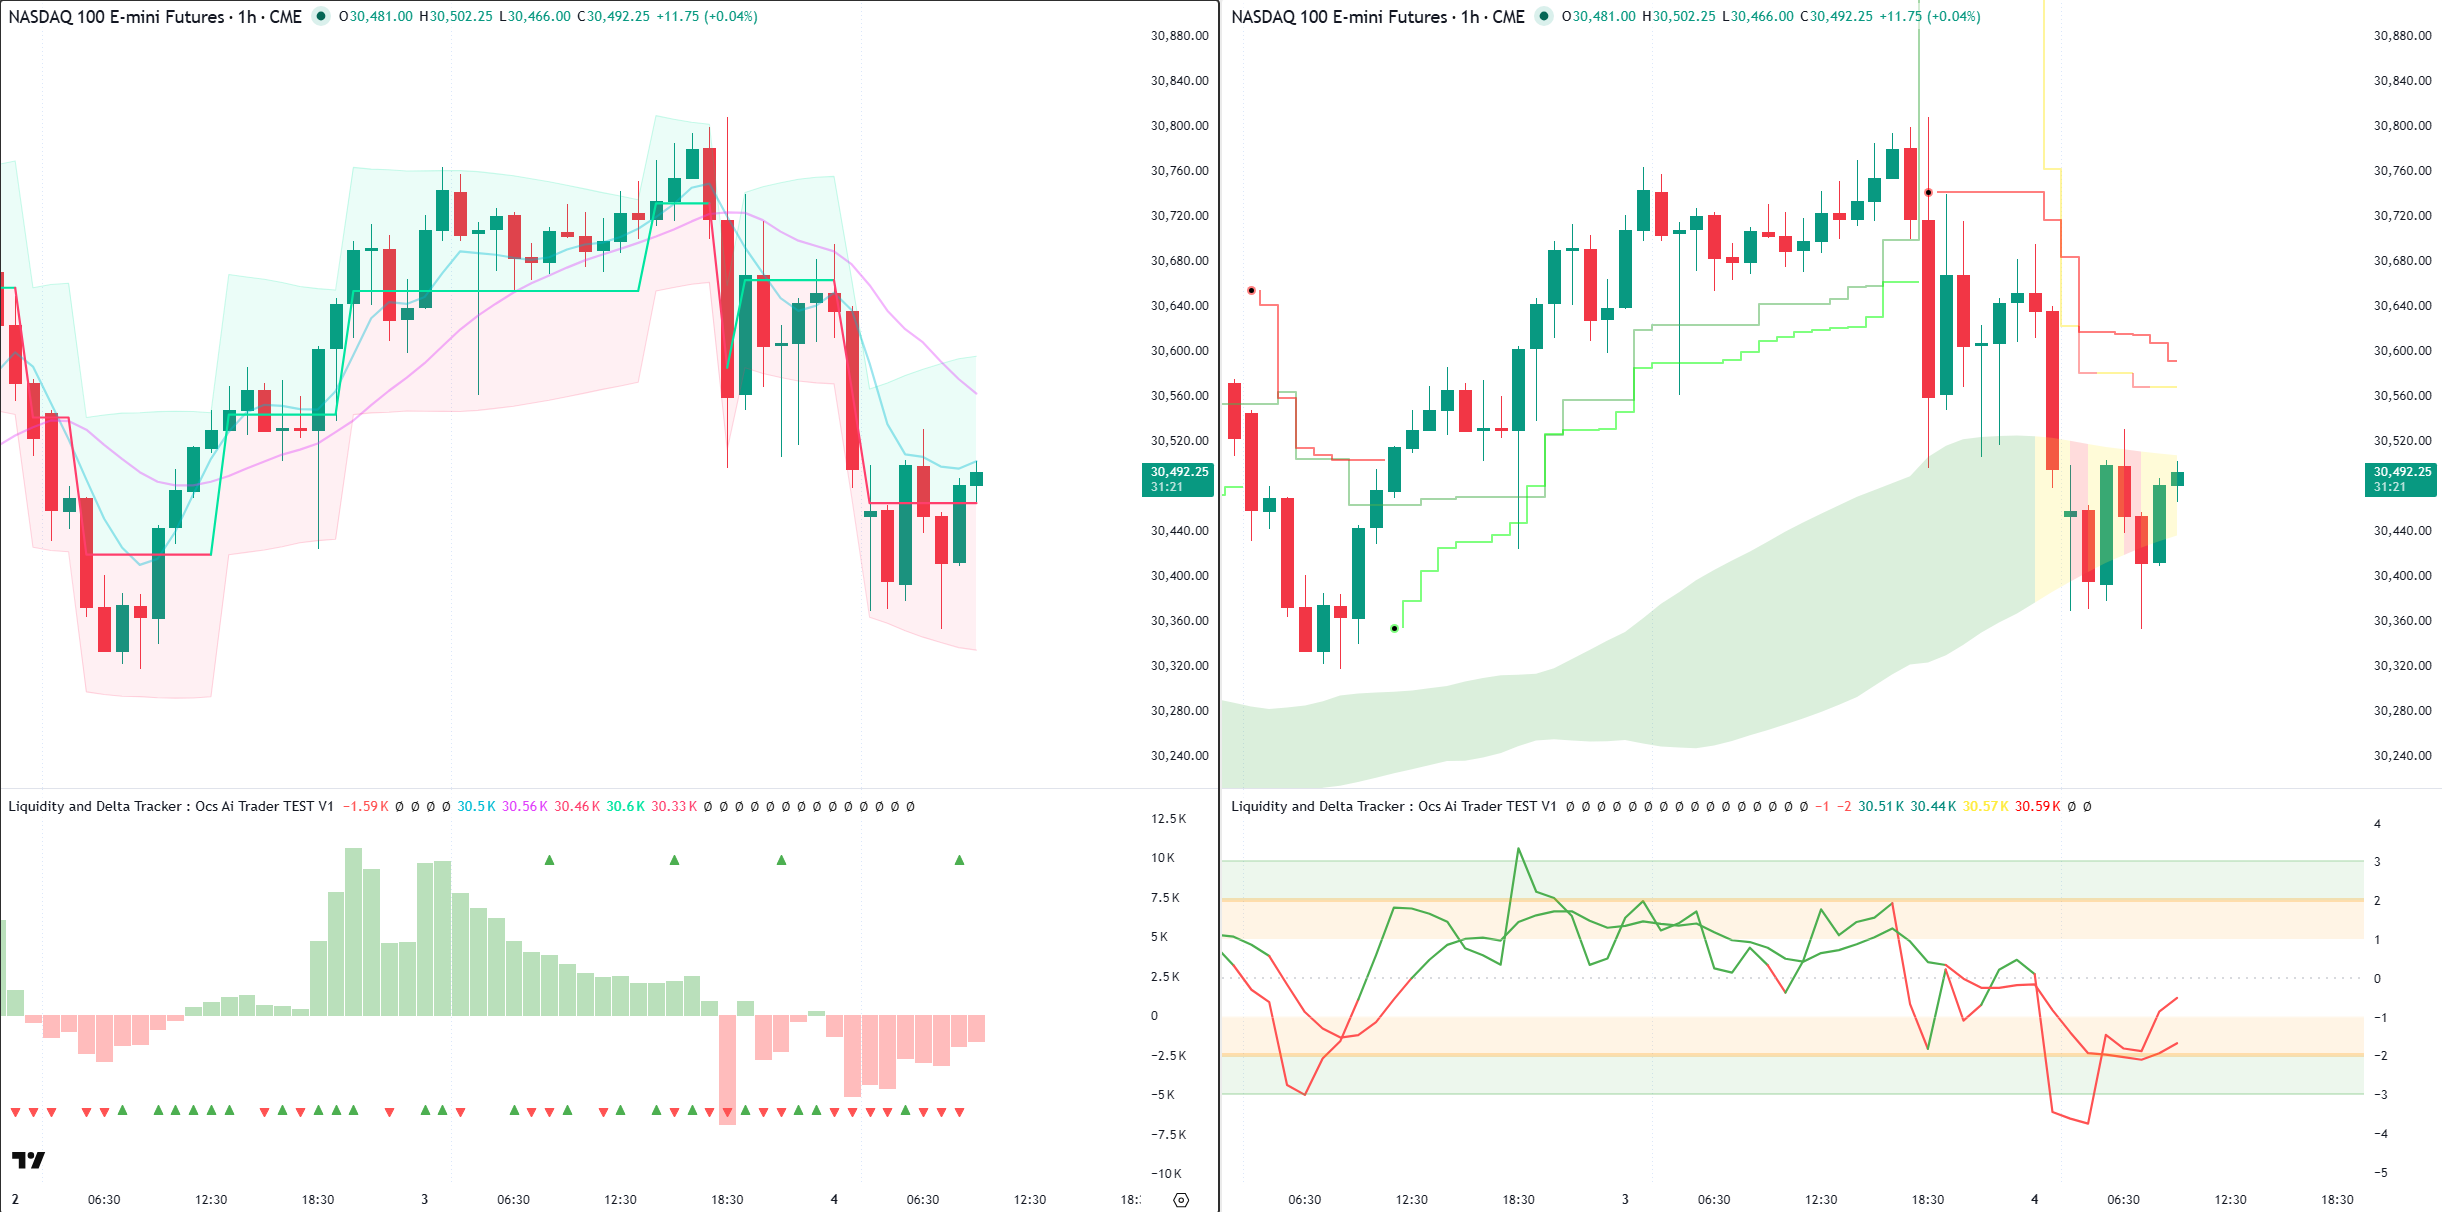
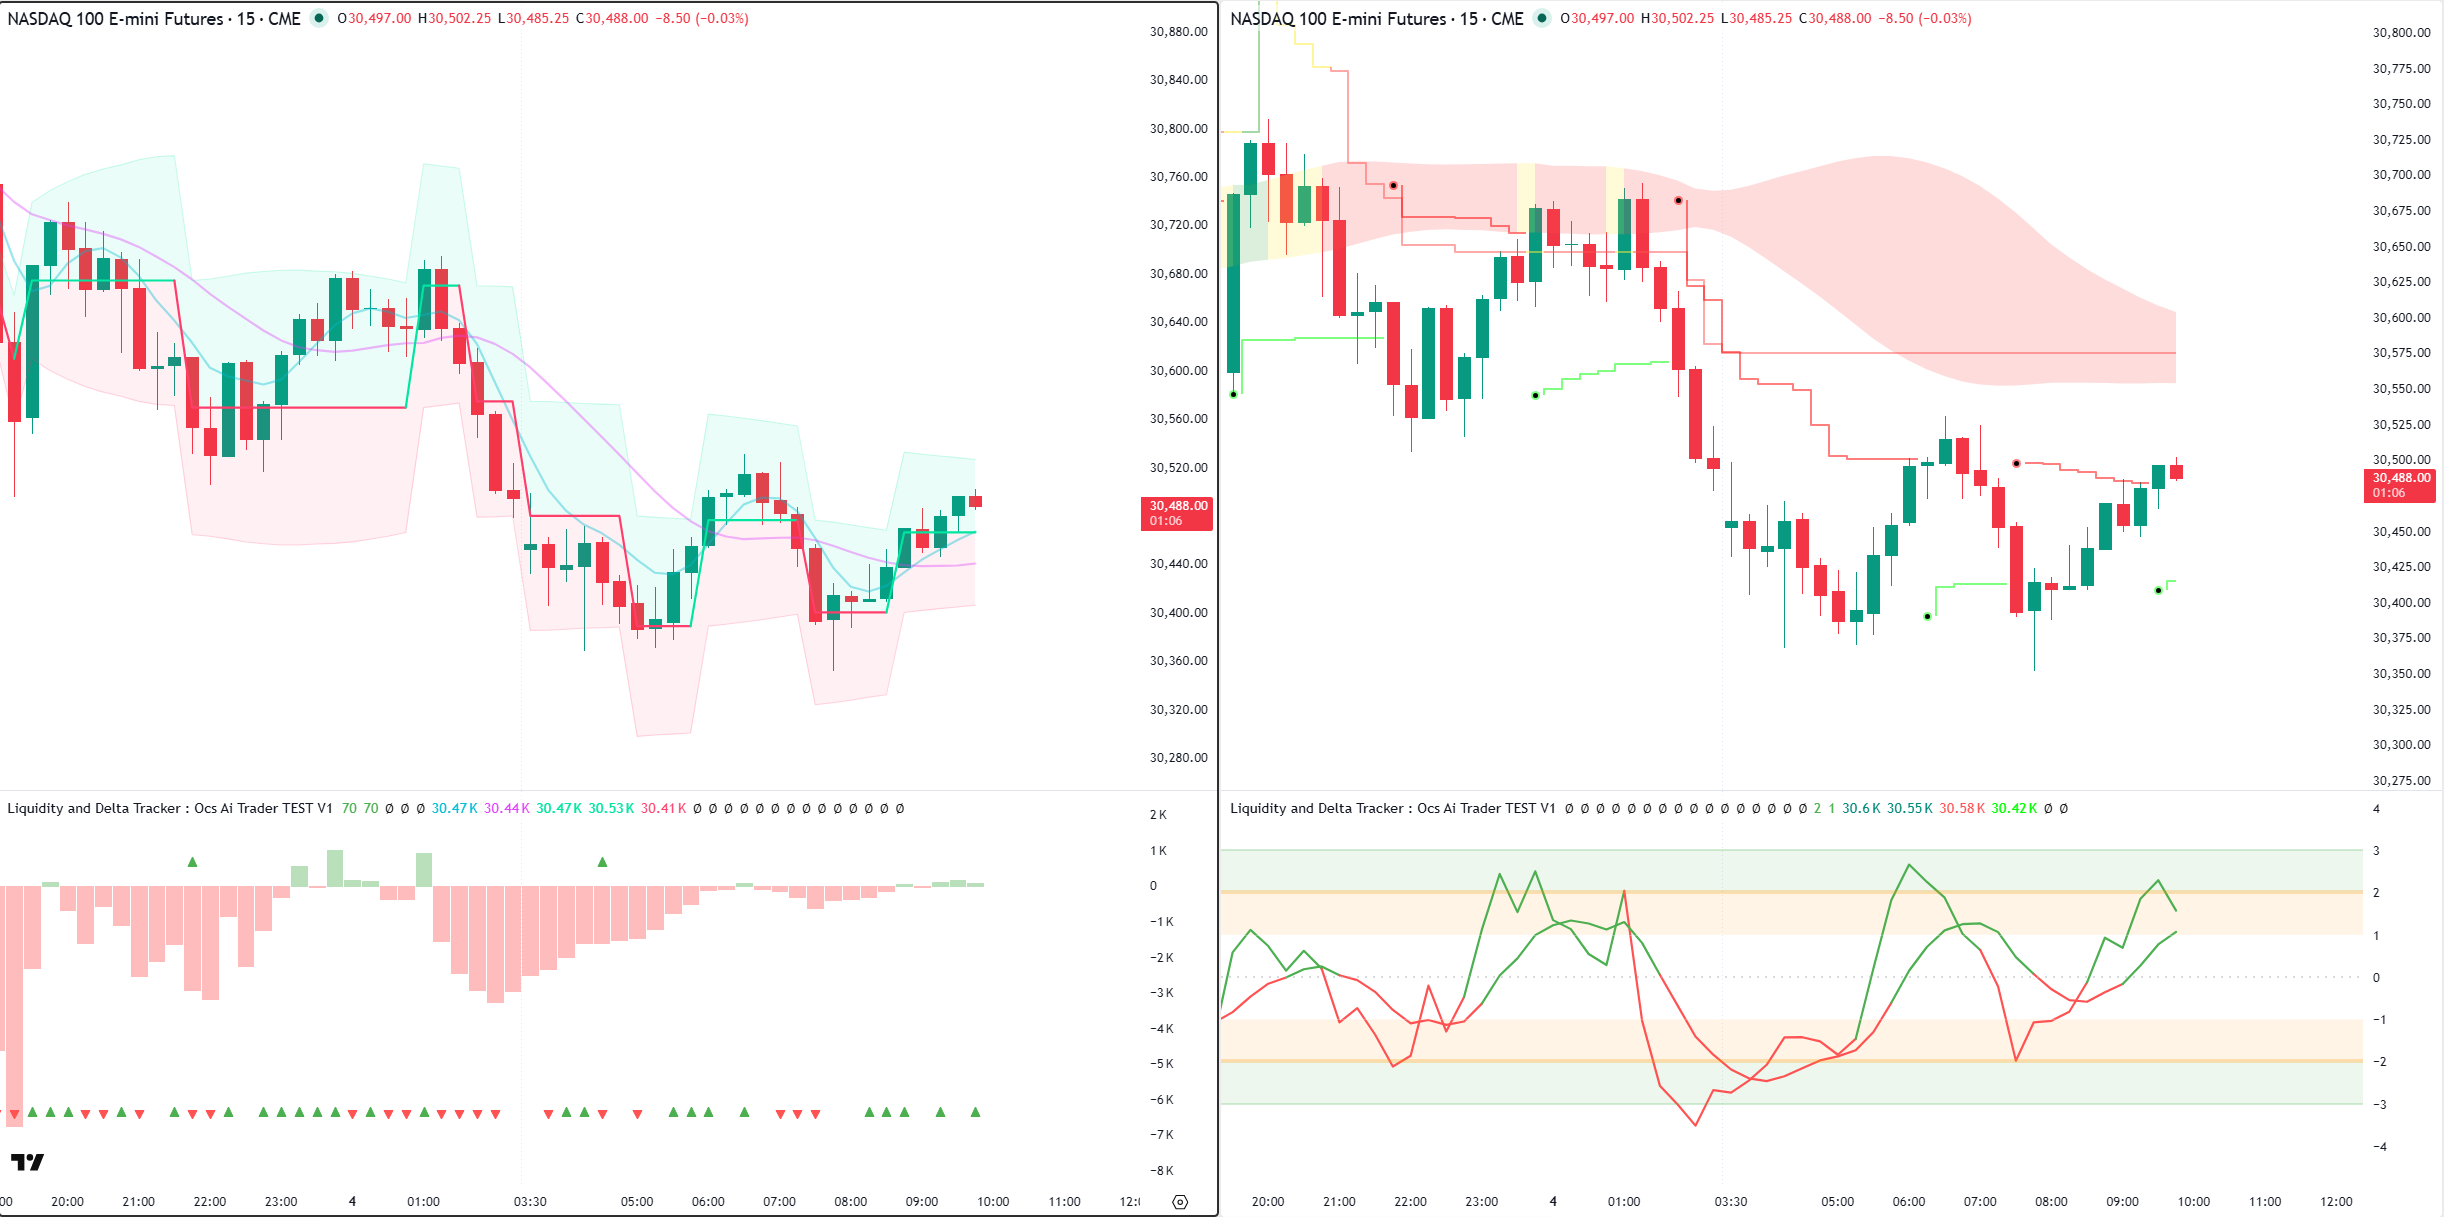
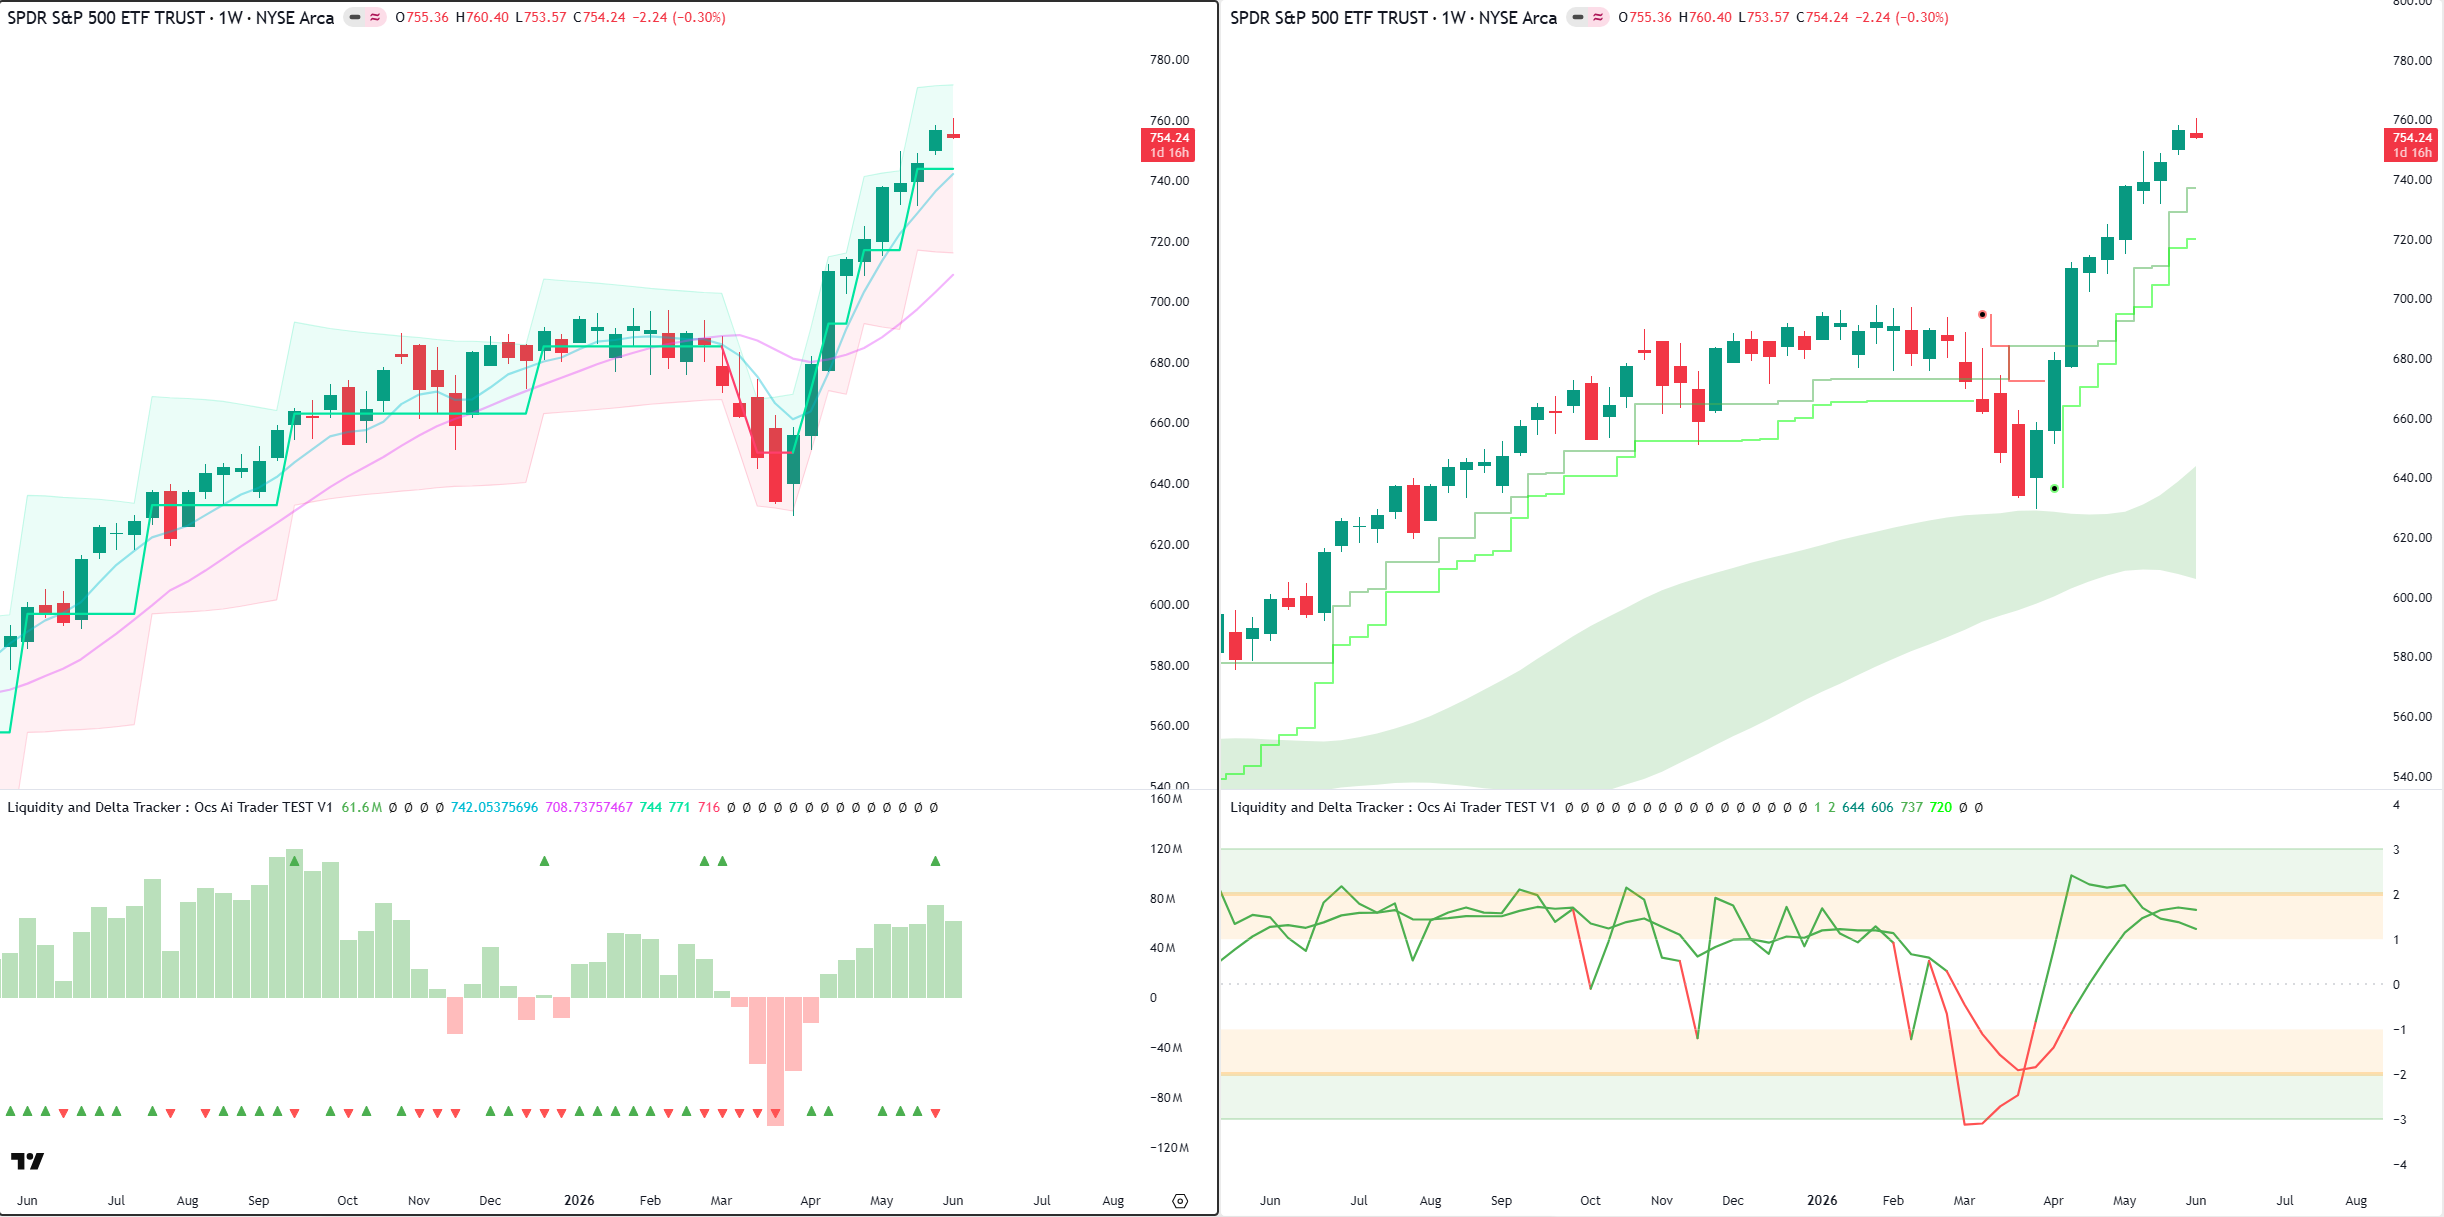
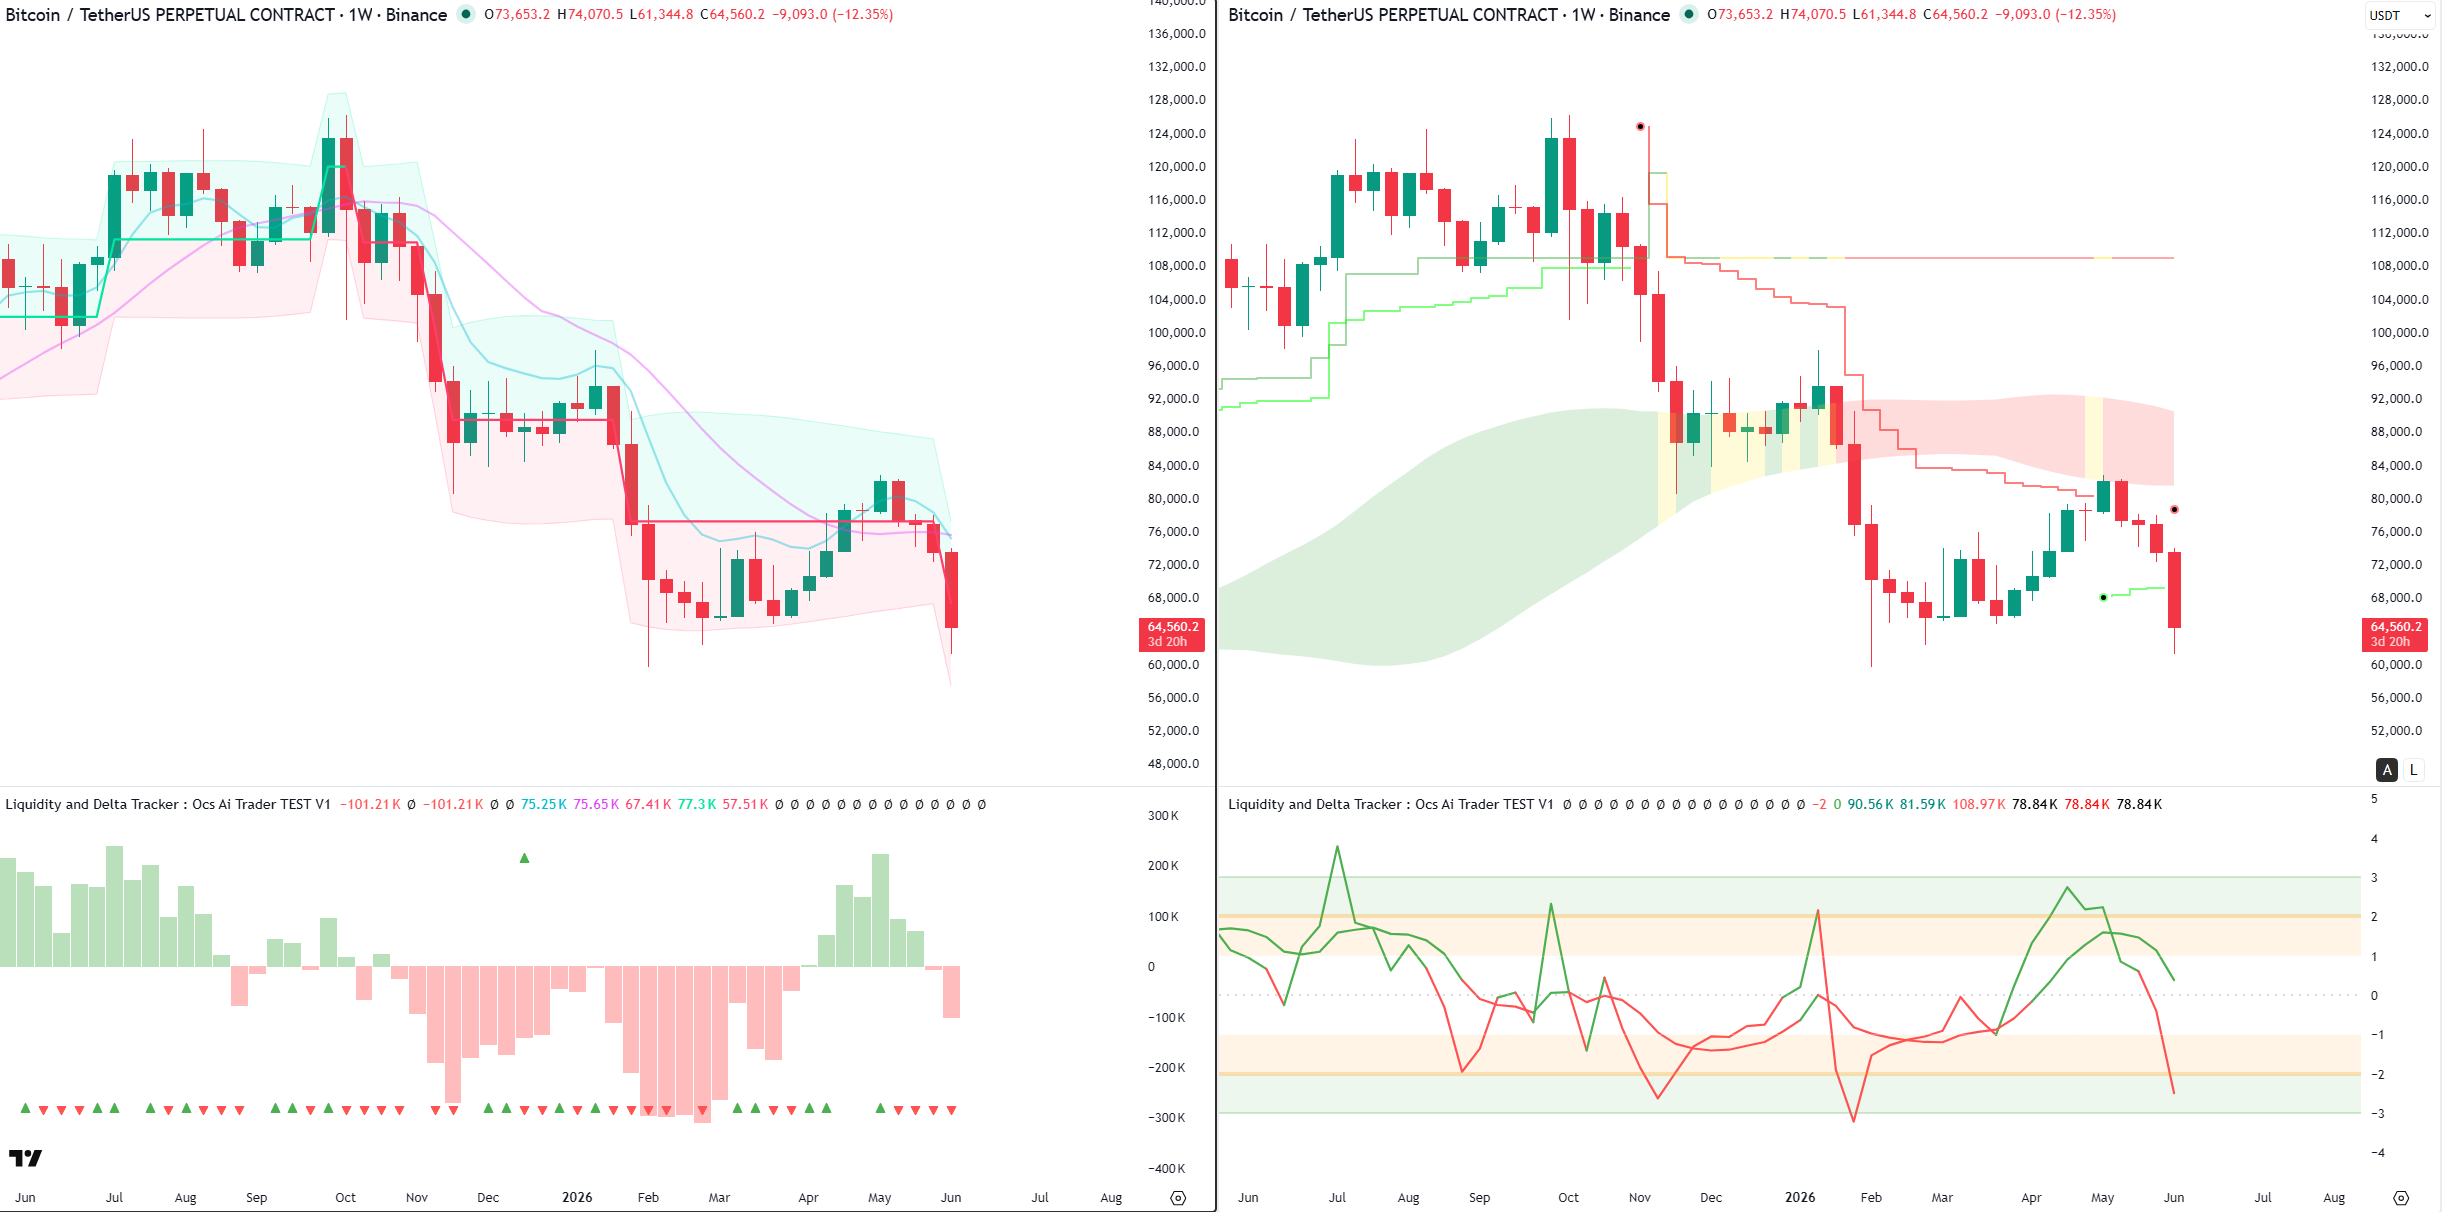
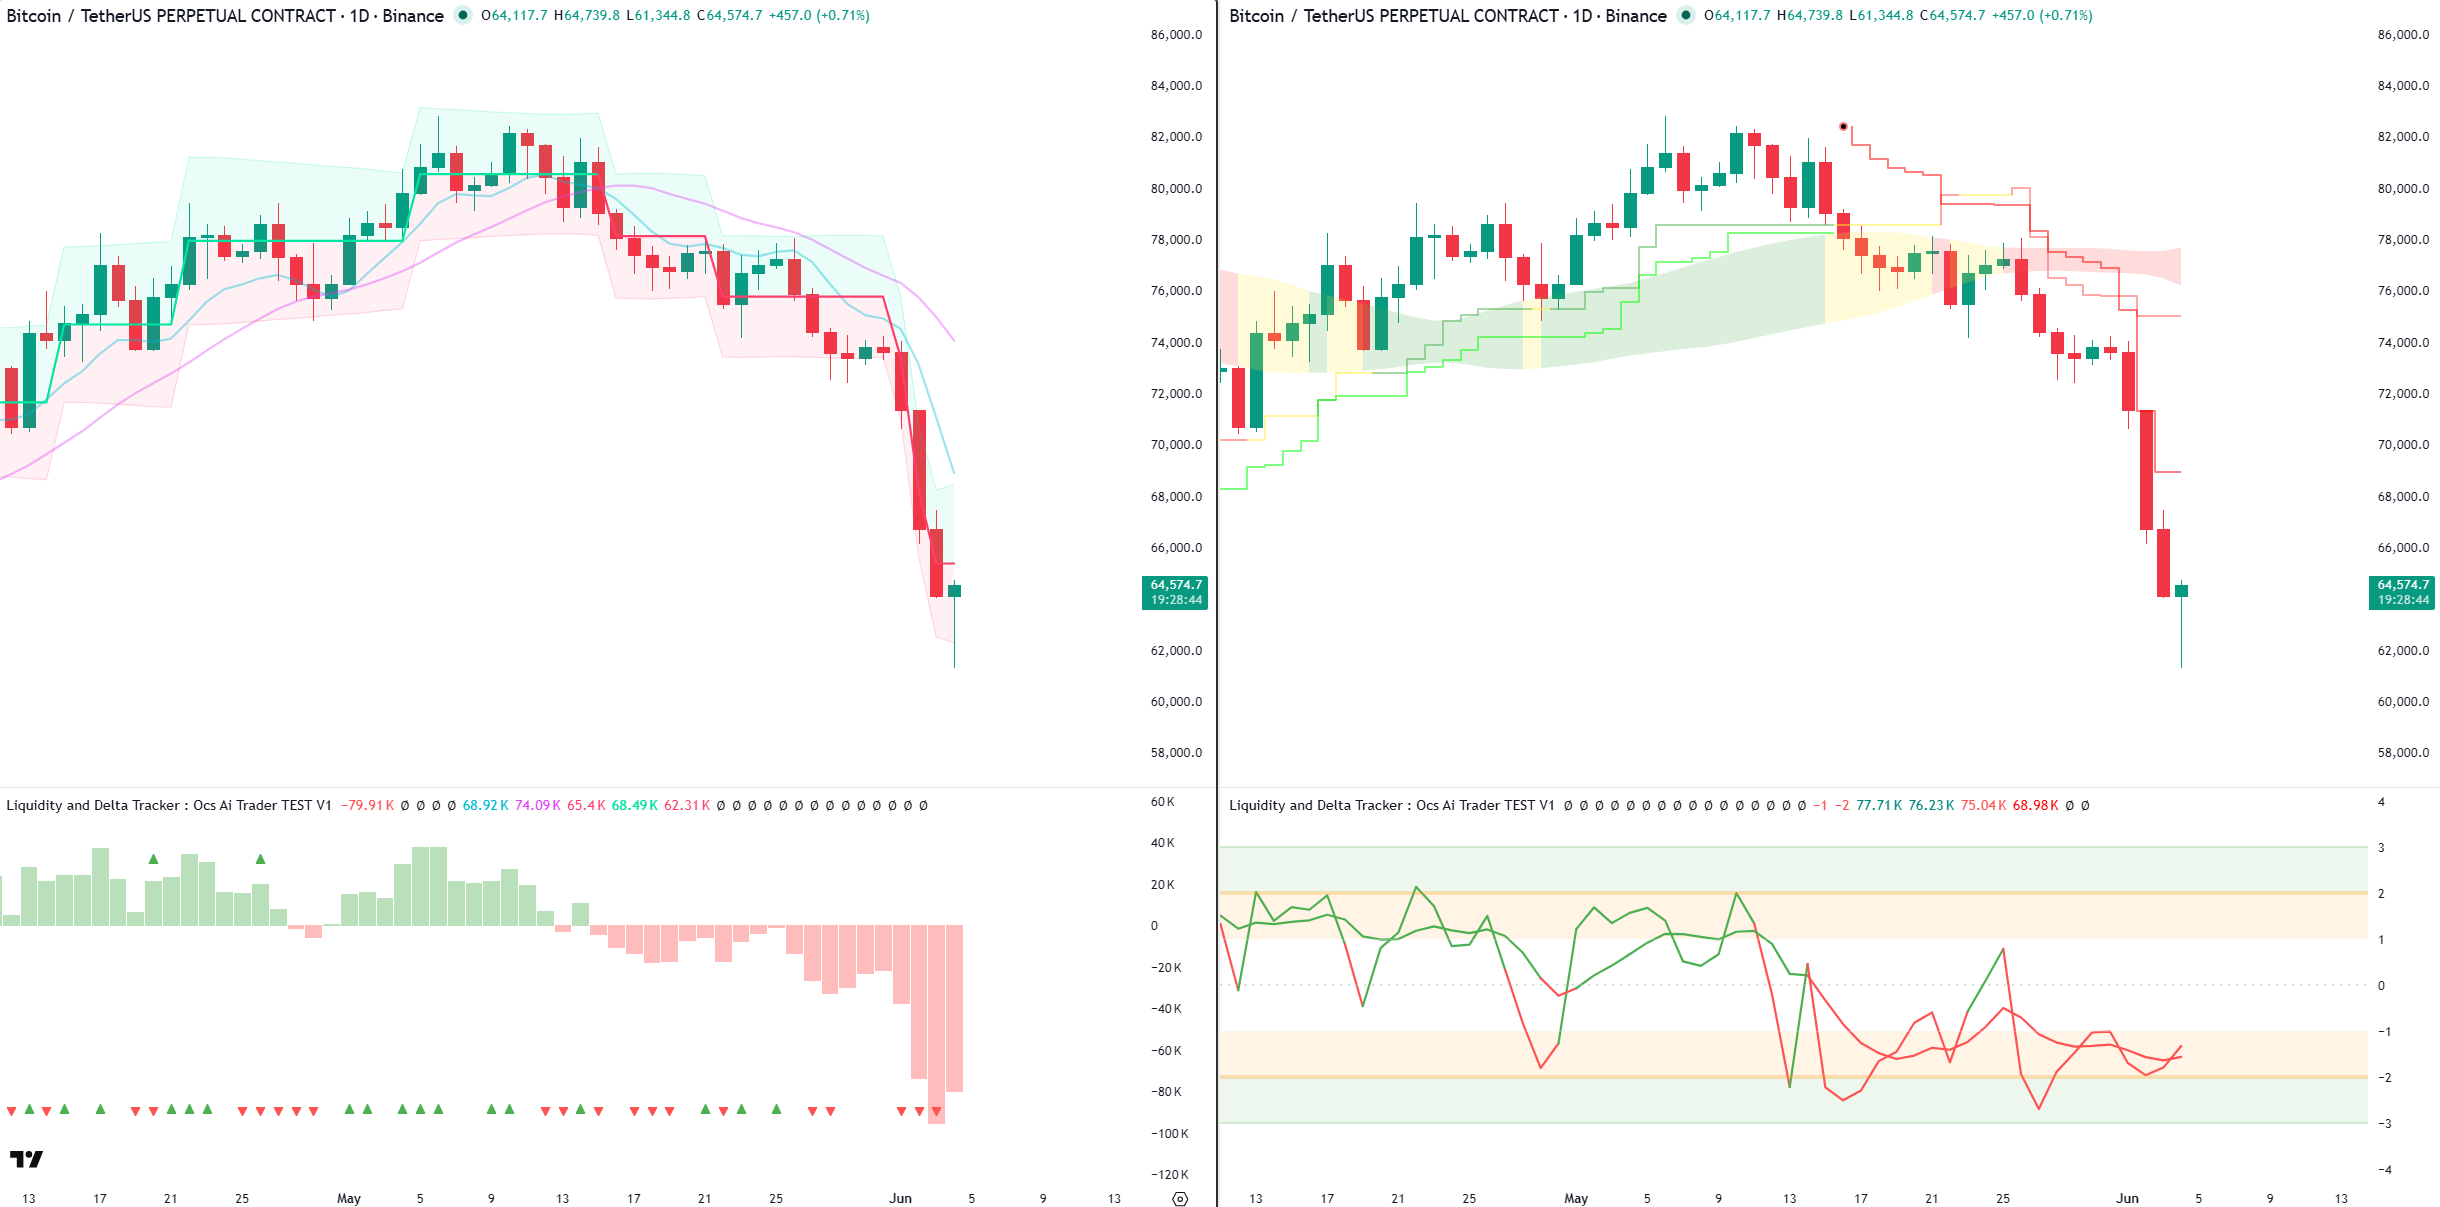
Liquidity bands, delta footprint & CVD — Nasdaq, S&P 500 and Bitcoin across timeframes. Illustrative screenshots, non-live.
Both indicators are decision-support
tools, not a signal service. No indicator removes the need for risk
management, position sizing, or discretion. Examples use sample data.
The Signal Engine, Explained
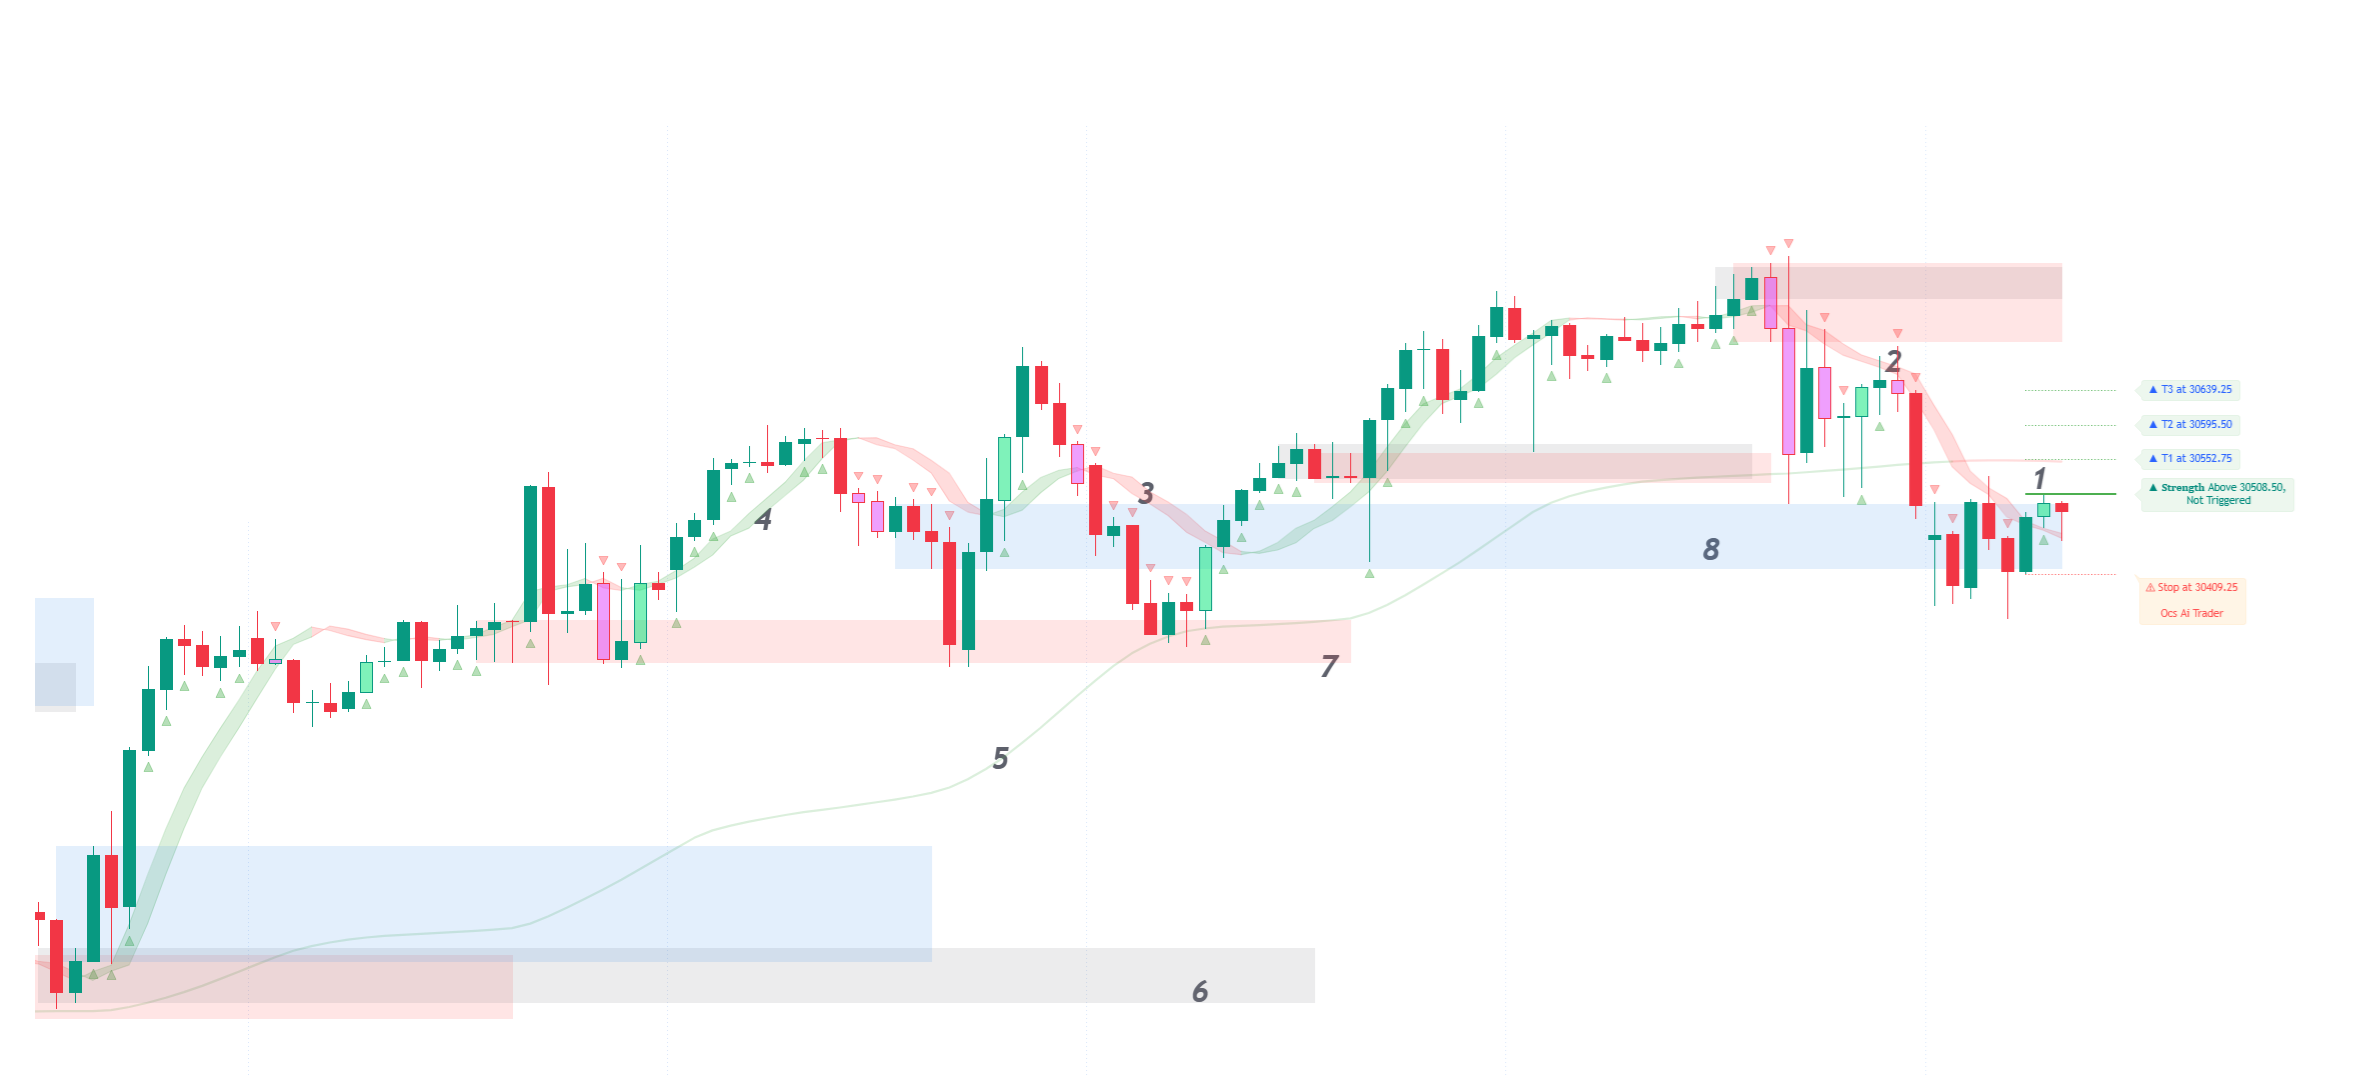
Ocs Ai Trader — every element on the chart.
Beneath a four-layer engine (time-series → signal processing → machine learning →
a virtual-trade emulator) sit eight visual components you actually read live.
The map below numbers each; the legend decodes it with its exact on-chart colour.
Components numbered 1–8 — signal candles, momentum bands, the dominant-cycle ribbon and the three float-volume tiers. Illustrative, non-live.
Signal & momentum layer
1Strength Signal Candle#71EAB9 — the classifier’s point of declaration for upside continuation: the bar on which a directional bias resolves into a defined-risk structure. Prints in soft green with the full scaffold — “Strength Above [price]”, the trigger, a stop, and T1→T5 above. Participation is taken at the trigger, never at the candle’s close; declaration and confirmation are deliberately decoupled so every signal is auditable.
2Weakness Signal Candle#F088D2 — the symmetric declaration for downside continuation — soft pink, with “Weakness Below [price]”, trigger, stop and T1→T5 stacked below. A signal that prints but never trips its trigger is treated as market posture — information about intent, not an actionable trade.
3Momentum Band — Weakness#FFDCDC — a composite envelope reading net-bearish across a 21-member panel (HP decomposition, KAMA, TRIX, Fisher transform, KNN, adaptive LMS…). Because its colour flips only on genuine cross-read consensus, it filters the single-indicator whipsaw; price tends to find dynamic resistance on the band’s upper edge through counter-trend pullbacks.
4Momentum Band — Strength#DBEFDC — the bullish counterpart — the same 21-component consensus reading net-positive, acting as dynamic support on the lower edge. A signal candle that prints inside a matching-colour band is first-order confluence: the bar-level classifier and the composite momentum panel agree on direction.
5Dominant Cycle (Ehlers)#DBEFDC — the instrument’s active periodicity, recovered per bar via Ehlers DSP rather than a fixed lookback. The validated cycle length is fed back as a dynamic parameter into the bands, signal generation and target placement — the mechanism behind the system’s cross-instrument, cross-timeframe adaptivity. A flattening ribbon = a stabilising cycle; a steep one = a regime in transition, exactly where fixed-period tools read worst.
Structure — Float Volume Ranges
These tiers are the indicator’s order blocks — the price regions where committed
(often institutional) size transacted and resting orders cluster. Computed against the active
float (tradable supply) rather than raw bar volume, they answer the structural question:
where will this move meet real supply or demand? Intensity is graded into three tiers.
6Float Volume — Average (Gray)#ECECED — a baseline order block: a region that absorbed ordinary float. A genuine reference level, but one that typically yields only a mild first-touch reaction.
7Float Volume — Extreme (Red)#FFE5E5 — the dominant order block in view — the heaviest historical absorption of tradable supply, and the system’s strongest static support/resistance candidate. A clean break through a red zone is a materially higher-significance event than a break of the lighter tiers.
8Float Volume — Above-Average (Blue)#E3EFFC — a secondary order block of concentrated participation — where price commonly pauses, mean-reverts, or partially absorbs before continuing. Mid-tier structure sitting between baseline and extreme.
Context first: a Strength signal firing into a red order block above is a fundamentally
different read from the same signal in open space.
A Living Map
The adaptive system map
From the four-layer engine to every on-chart component — and how they layer into one read.
Drag any node to explore; hover to learn what it does.
Read in layers
How the components work together
A signal in isolation is one read. The same signal against the surrounding three layers is a contextualized read.
1 · Float Volume Ranges
Set the static structure — where are the high-participation zones price is moving between?
2 · Dominant Cycle
Set the active period reference — is the cycle stable, or transitioning?
3 · Momentum Bands
Set the composite-momentum regime — strength or weakness on the 21-member panel?
4 · Signal Candle
Declares the actionable structure — trigger, stop and T1–T5 are now defined.
Trigger discipline
The trigger is the point of participation, not the candle close. A signal that prints but never triggers is posture, not a missed trade.
Target labels
Targets flip to Booked once crossed. Booking T1 then reversing is a complete event — the system never re-labels.
Stop integrity
The stop is part of the scaffold. Moving it after entry turns a defined-risk read into a discretionary one — know the trade-off.
Timeframes
Adaptive components (cycle, bands) work intraday and higher; very sparse-volume charts thin out the float-volume layer.
The Indicator, Explained
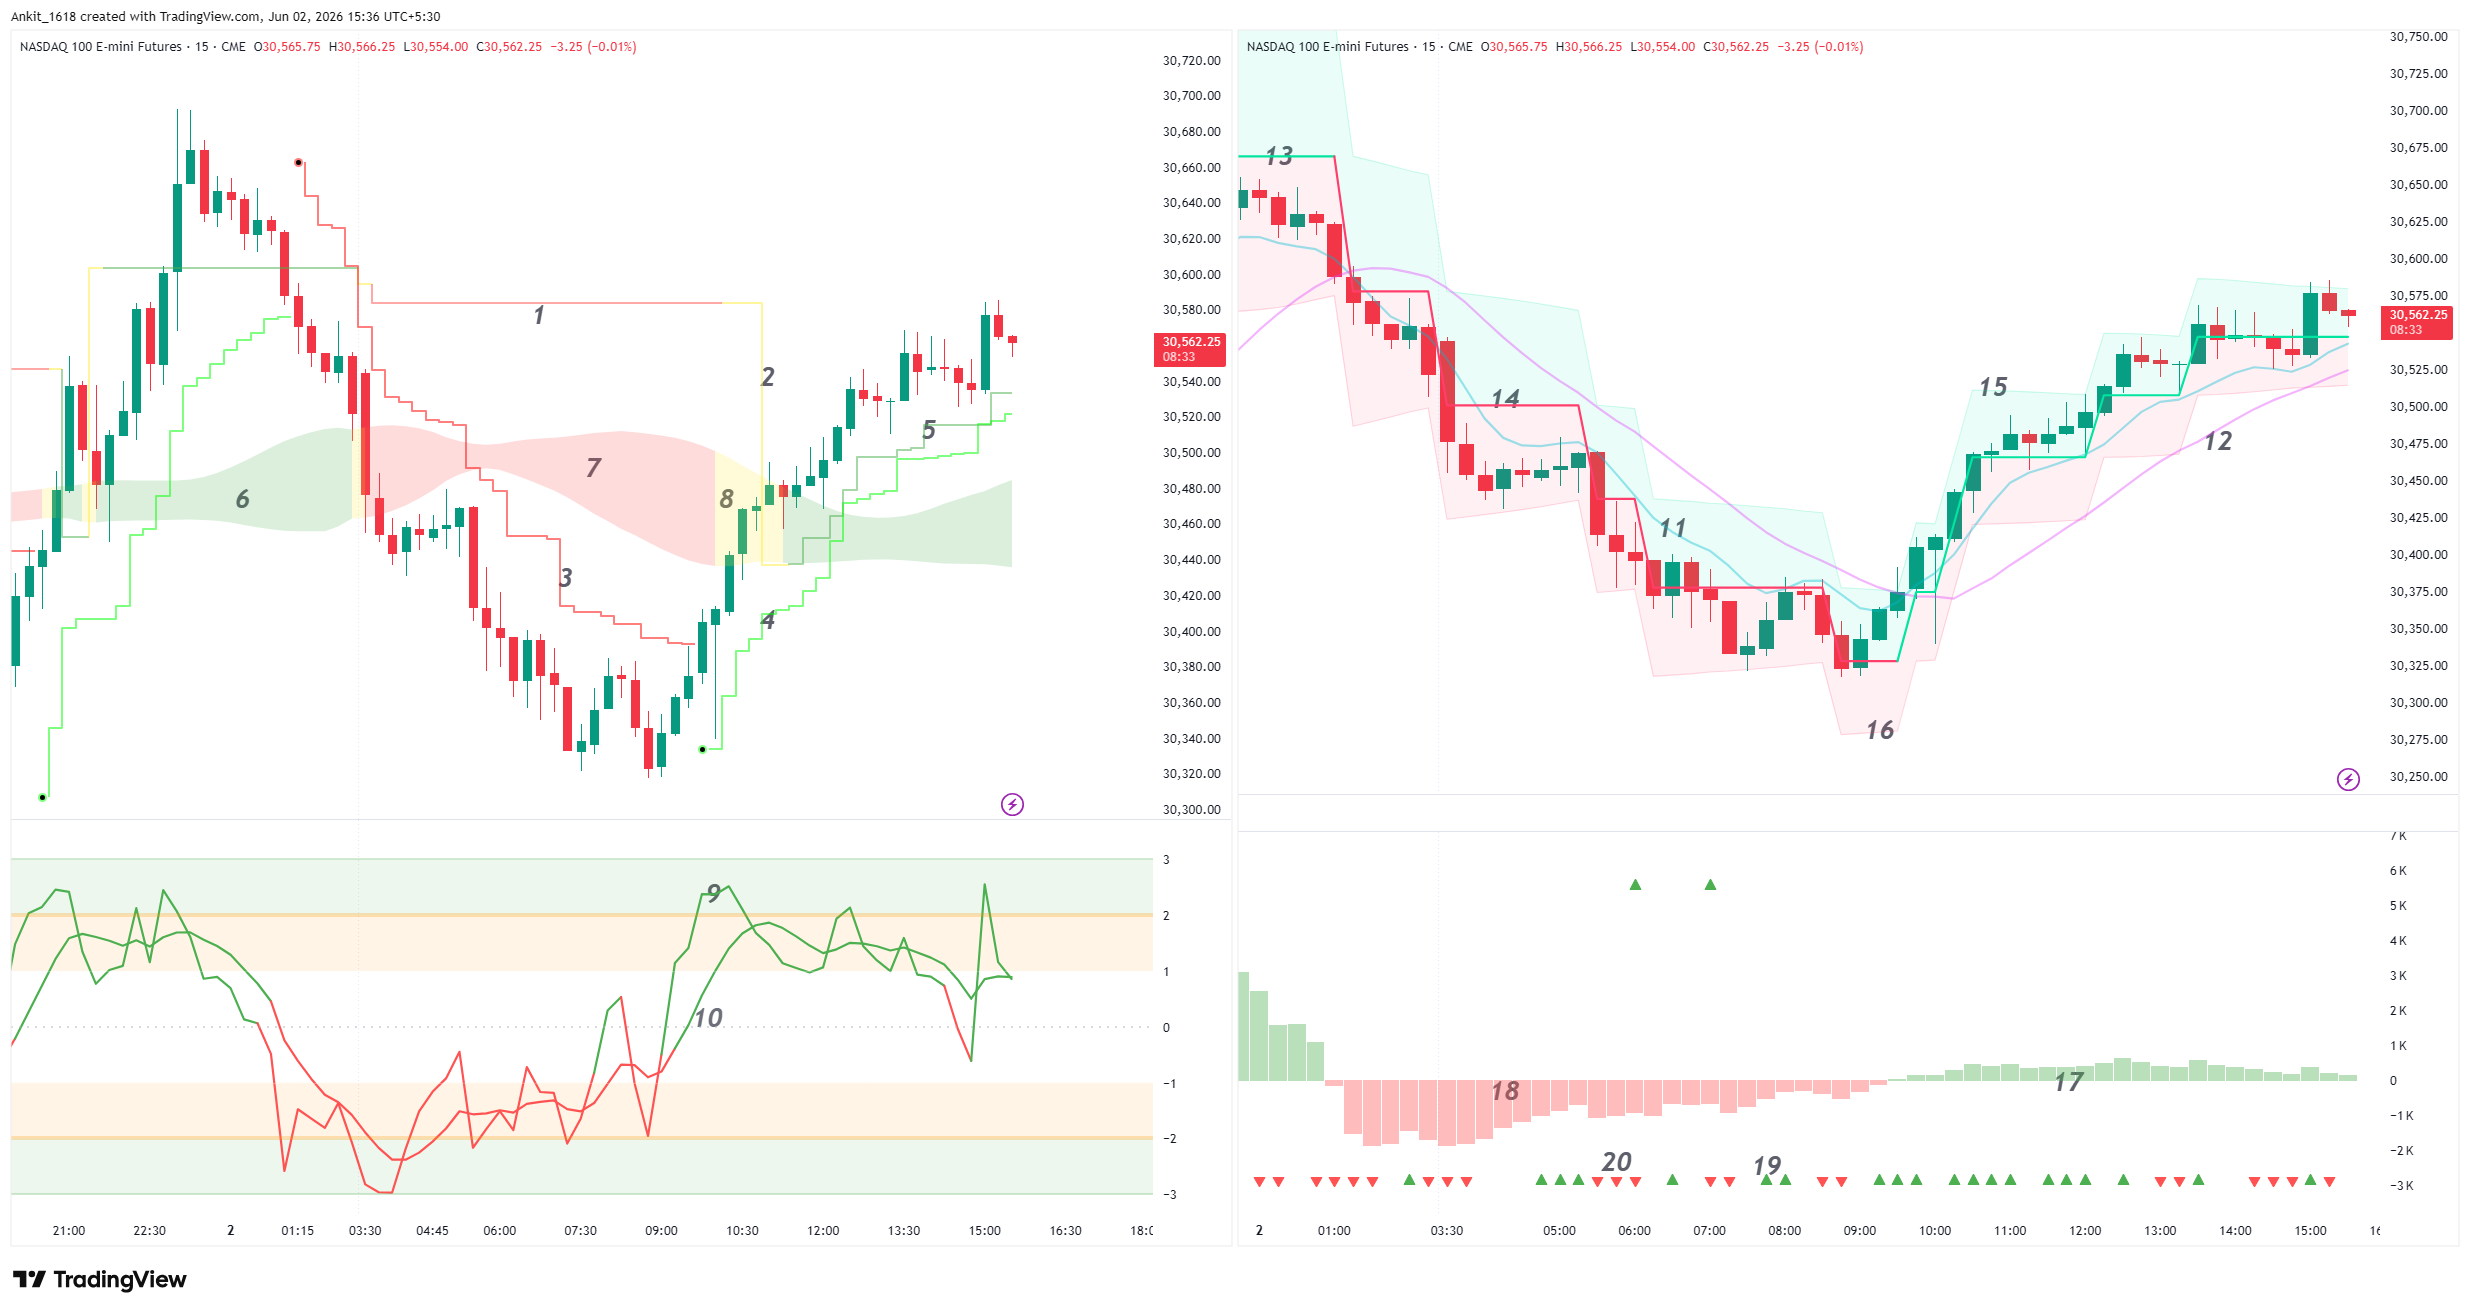
The Liquidity & Delta Tracker markers on the chart, decoded.
The Liquidity & Delta Tracker reads the two forces price has no choice but to
obey. Liquidity is the clutch — adaptive lines and bands that act as
regime-aware support/resistance. Delta is the engine — the aggressive volume
actually being committed. The map below numbers every component; the legend explains each.
Every component numbered 1–20 — Liquidity Engine (price panel + oscillator) and Delta Engine (volume panel). Illustrative, non-live.
Layer 1 — Liquidity Engine (price-side)
1Slow Negative Liquidity Line#FF5252 — the longer-horizon bearish liquidity ceiling. While price holds beneath it the macro regime is distributing — rallies are supply being sold into, not strength to chase.
2Uncertain Liquidity Line#FFEB3B — the neutral, transitioning regime. When this is the active line the market is between states: breakouts are unreliable and risk is asymmetric, so size down or stand aside until conviction returns.
3Fast Negative Liquidity Line#FF0000 — short-horizon bearish liquidity that reacts quickly to fresh selling. Inside a downtrend it’s the first level price tests on counter-trend bounces — and usually where they fail.
4Fast Positive Liquidity Line#00FF00 — short-horizon bullish liquidity; the first line to flip when intraday buyers regain control. An early tell that momentum is rotating up before the slow lines confirm.
5Slow Positive Liquidity Line#4CAF50 — the longer-horizon bullish liquidity floor. Price holding above it means the macro regime is accumulating — dips are demand, and pullbacks are to be bought.
6Positive Liquidity Band#4CAF50 — the bullish liquidity zone wrapping the lines — where price is absorbed and re-fueled. Pullbacks into it during an uptrend are high-probability longs while the clutch stays engaged forward.
7Negative Liquidity Band#FF5252 — the bearish liquidity zone. Rallies into it during a downtrend are high-probability shorts as resting supply re-engages and rejects price.
8Uncertain Liquidity Band#FFEB3B — the transition zone where the market is actively deciding. The disciplined play is patience — let the band flip colour and confirm a regime before committing size.
9Fast Liquidity Cycle Line#4CAF50 / #FF5252 — the divergence workhorse on the oscillator (colour-shifting). When price prints a fresh low but this cycle makes a higher low, liquidity has stopped supporting the move — a reversal is quietly loading.
10Slow Liquidity Cycle Line#4CAF50 / #FF5252 — confirms the fast line’s divergences and filters low-quality signals. When both cycles diverge against price together, the read is materially stronger than either one alone.
Layer 2 — Delta Engine (volume-side)
11Positive Dominant Cycle#00BCD4 — the rhythm of dominant buying pressure extracted from the volume footprint. Rising and above its negative twin means buyers are setting the session’s tempo.
12Negative Dominant Cycle#E040FB — the rhythm of dominant selling pressure. A positive-over-negative crossover is one of the cleanest regime-change tells — it frequently leads the liquidity flip on price, giving you advance warning.
13Positive Adaptive Delta Filter#00E5A0 — the self-calibrating floor of validated bullish delta. A pierce above it confirms aggressive buying has cleared the noise threshold — real commitment, not drift.
14Negative Adaptive Delta Filter#FF3E6C — the adaptive ceiling of validated bearish delta. A pierce below confirms aggressive selling has genuinely committed, filtered against the asset’s current volatility.
15Upper Boundary — Positive Delta#00E5A0 — the statistical ceiling of expected positive delta. As the filter nears it, buying is reaching an extreme — stay alert for exhaustion and pullbacks rather than chasing.
16Lower Boundary — Negative Delta#FF3E6C — the statistical floor of expected negative delta. As the filter nears it, selling is overstretched — watch for short-covering and reversals. Filter + boundaries form a delta volatility envelope.
17Positive CVD Columns#4CAF50 — cumulative net aggressive buying across the session. Tall and rising shows commitment stacking; stalling near a price high is a textbook bearish divergence — force quietly fading.
18Negative CVD Columns#FF5252 — cumulative net aggressive selling. Stalling near a price low while price extends is a textbook bullish divergence — one of the most reliable reversal tells across instruments.
19Positive Delta Force ▲#4CAF50 — a single bar that carried significant net buying. It flags potential bullish acceleration in the next bars — highest-grade when it fires inside a positive band with CVD rising and the positive cycle leading.
20Negative Delta Force ▼#FF5252 — a single bar that carried significant net selling, flagging potential bearish acceleration. In isolation it’s noise — its edge is in confluence with liquidity and CVD.
A Living Map
The adaptive system map
How the two engines fan out into every component — and converge into one read.
Drag any node to explore; hover to learn what it does.
Read as a system
The confluence playbook
No marker is a trigger on its own — edge comes from agreement across liquidity, delta and CVD.
Trend-Continuation Long
Price above the slow positive line, inside the positive band; positive dominant cycle leading; CVD positive and rising; a green force ▲ on the pullback.
Entry: arrow candle close · stop below the slow positive line.
Trend-Continuation Short
The mirror: price below the slow negative line, inside the negative band; negative dominant cycle leading; CVD negative and extending; a red force ▼ on a relief rally.
Entry: arrow candle close · stop above the slow negative line.
Reversal (Mean-Reversion)
New price extreme but the fast cycle and CVD print a divergence; the Δ filter touches its boundary (exhaustion); the uncertain band starts forming — the clutch is slipping.
Entry: first close back inside the uncertain band, scaling on the flip.
The “Hands-Off” filter
Uncertain band active, dominant cycles tangled, CVD flat. The indicator is telling you the clutch is disengaged.
Action: sit out — protecting capital is the trade.
Timeframes
Adaptive across timeframes; shines intraday 5m–1h on liquid instruments (index futures, large-caps, major FX, BTC/ETH).
Non-repainting
Displayed levels don’t reprint. Fast cycles & per-bar arrows update live within the forming bar and confirm on close.
Settings
Two modes — Liquidity and Delta. Defaults are pre-tuned; no configuration needed to start reading the regime.
Alerts
Built-in alerts for Bullish Delta Liquidity and Bearish Delta Liquidity.
Part of the Ocs Ai Trader research stack — built on the principle that
price is an output, not an input. A decision-support tool, not a signal service; it never
removes the need for risk management and discretion.